Figures & data
Figure 1. Reference map showing the major fluvial channels palaeolakes mapped from SIR-C (e.g., Edgell 2006, Dabbagh, Al-Hinai, and Khan Citation1997), and aerial photographs (e.g., Clarck 1989). Black line highlights water divide and green polygons highlight the circular farms densities in the region. The yellow line divides the region into renewable and non-renewable groundwater zones. Features in the figure reproduced with kind permission from Springer and Business Media. For full color versions of the figures in this paper, please see the online version.
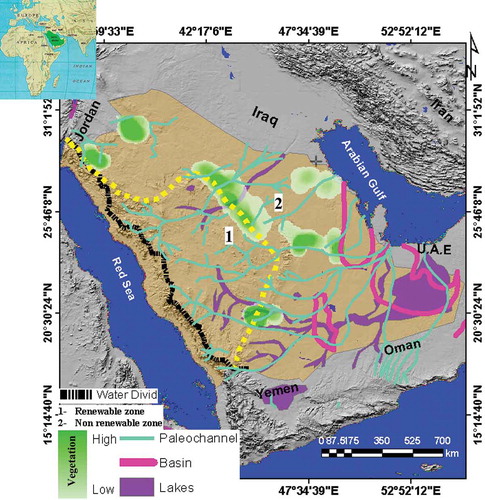
Figure 2. Geological map of the study area showing lithological units and structural geology control groundwater accumulation and quality.
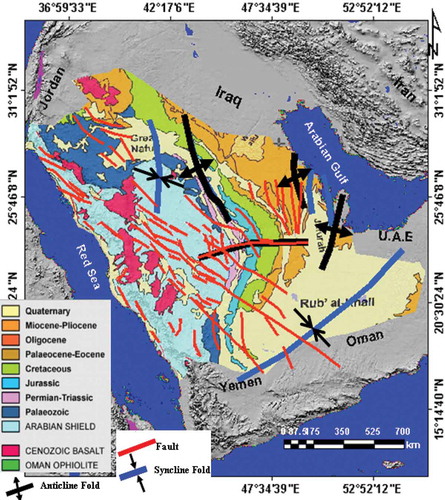
Figure 3. Rainfall map showing the spatial distribution of rainfall over the region. Red points highlight the International Wheat Improvement sites (IWIN).
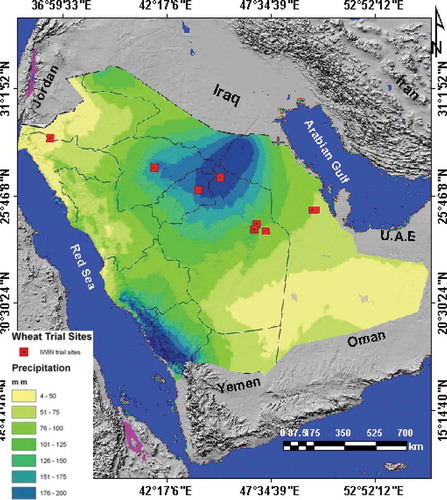
Table 1. Major fossil water aquifers in Saudi Arabia.
Table 2. Fluvial channel and mega-basin weights and information values (IVs). These fluvial channel have positive association to the topographic wetness and are, therefore, enhancing the predictive power. Mega-basins that have negative or no association to the spatial distribution of palaeochannels are shown in brackets (*).
Figure 4. Flow chart of the methodology used for mapping fluvial channels and indexing topographic wetness. W+ and W– highlight the areas of good and bad fluvial channels distribution, respectively.
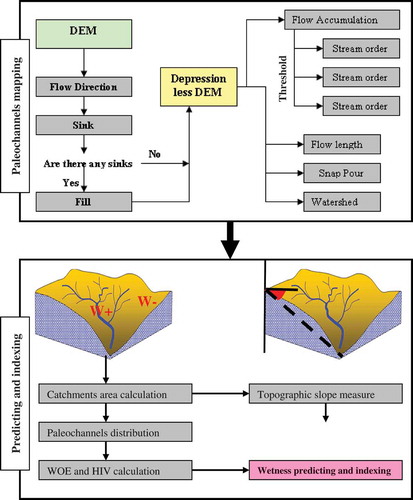
Table 3. Predictive soil wetness values of each mega-basin in the region.
Figure 5. Fluvial channel and mega-basin maps derived from SRTM DEM using D8 algorithm (a), and ENE–WSW topographic profile across the Saudi Arabia, showing flow direction and flow type in the region.
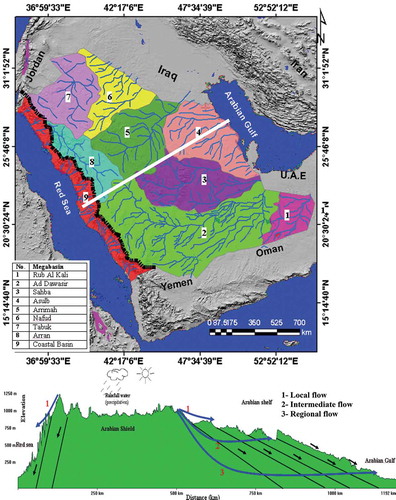
Figure 6. Zooms of fluvial channels derived from DEM using a D8 algorithm (a and b), from the corresponding Landsat 8 (c), and SIR-C image (d), showing detail of fluvial channels (wadis) on SRTM DEM, traces on Landsat 8 image, and fluvial fans on SIR-C image. These show the capability of the SRTM and SIR-C SAR sensors to imagine details of fluvial channels than optical sensors.
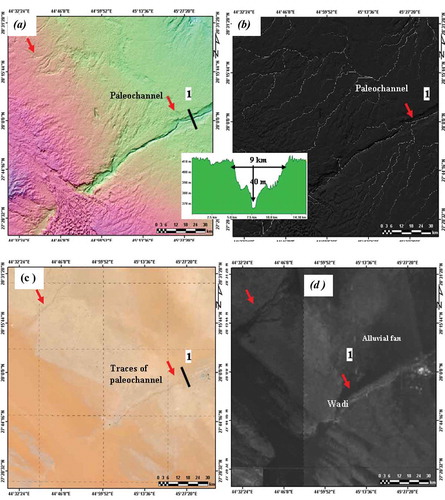
Figure 7. Maps of fluvial channel distribution (a), fluvial channel density (b), IV (c), and topographic wetness index (TWI) (d), showing the influence of the spatial distribution of palaeochnnels and slope on the topographic wetness in the entire region sensors.
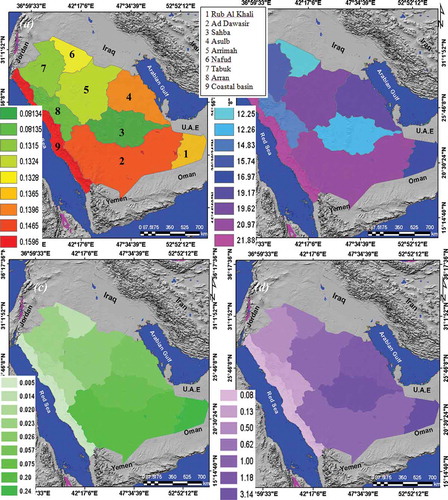
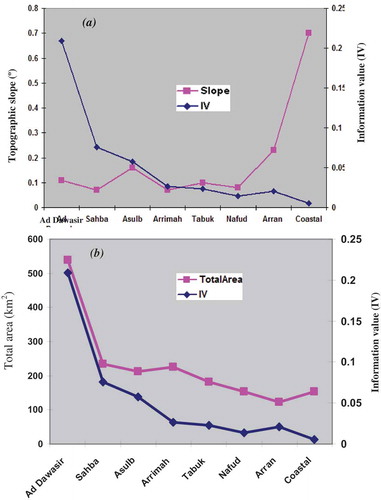
Figure 8. Graphs of topographic slope vis IV (a) and mega-basin area vis IV (b).