
Figures & data
Figure 1. Bathymetric map (in meter depth) of the Western Basin of Lake Erie and the locations of 18 sampling stations (in red) visited during multiple cruises on Research Vessels Gibraltar. The lake interacts with terrestrial environment through fluxes of the Sandusky, Portage, Toussaint and other rivers such as the Maumee and Detroit, which drain into the far western side of the basin. For full color versions of the figures in this paper, please see the online version.
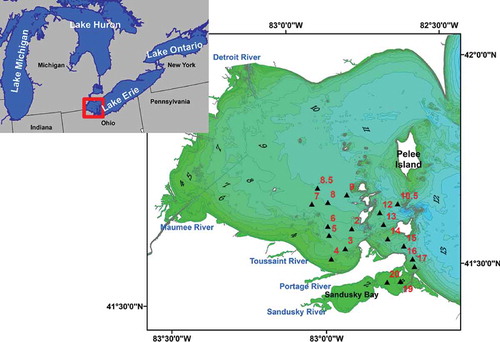
Table 1. Dates of each cruise and the date of the corresponding MODIS overpass of WBLE.
Table 2. Algorithms used to estimate chlorophyll a concentration (C) in μg/l from MODIS observations. Note that where the maximum operator (max) appears, the largest of the quantities in the square brackets is used.
Table 3. Descriptive statistics of chlorophyll a and TSM measured during five field campaigns.
Figure 2. Spatial variability of (a) chlorophyll a and (b) TSM, in the WBLE during five cruise periods.
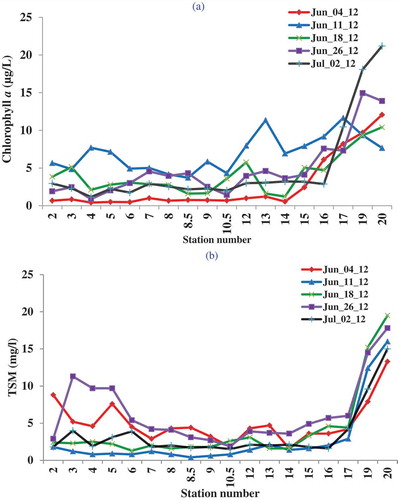
Figure 3. (a) Remote sensing reflectance (Rrs) spectra of the cruise stations and (b) the derivative of the Rrs spectrum for the MODIS observations.
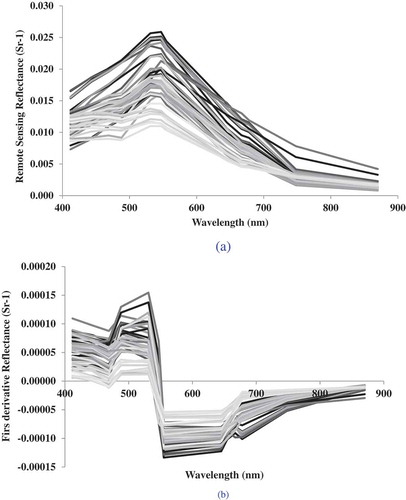
Table 4. Performance and comparison of the fifteen chlorophyll a algorithms applied to MODIS data, grouped by error response and sorted by bias.
Figure 4. Satellite chlorophyll a estimates comparisons against in situ concentration using fifteen ocean color models.
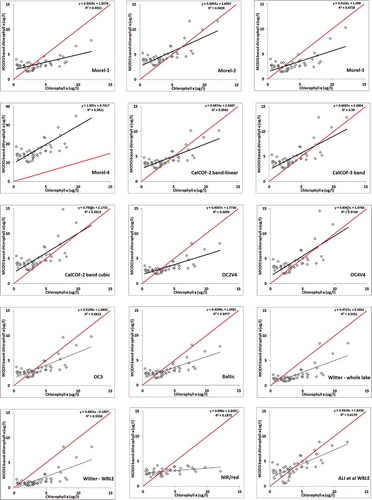
Figure 5. Correlation between the derivative spectrum and model errors for the chlorophyll a algorithms grouped by response (see for group membership list).
Table 5. Distribution of algorithms by potential bias.
Figure 6. The observed RMSE for the various algorithms presented as a function of samples size. The dotted line represents the expected RMSE for the OC4v4 vicarious calibration (n = 2803) extrapolated to smaller sample size based on the central limits theorem. Algorithms with RMSE values of <10% are performing as well as can be expected for the size of the vicarious calibration sample based on comparison with the central limits theorem, while those with RMSE of >10% exhibit bias that is greater than predicted by the central limits theorem.
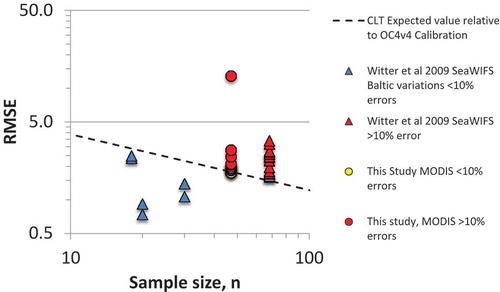
Table 6. Sensitivity of models performance on the mismatches of MODIS overpass dates relative to dates of in situ observations.