Figures & data
Figure 1. Entire study area and the sub-study area, located in Dalian, China. For full color versions of the figures in this paper, please see the online version.
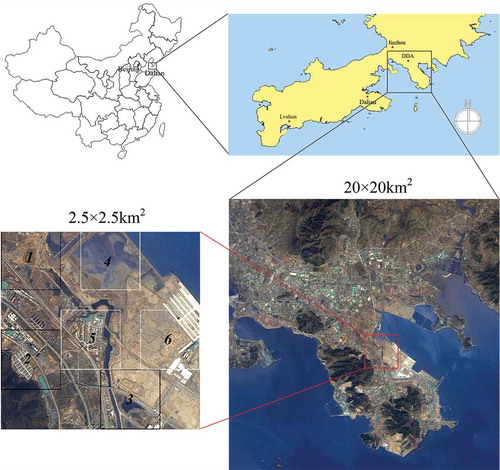
Figure 2. Topological graph of AUSD (a) Calibration phase and (b) Validation phase.
Figure 3. Flow diagram of AUSD.
Figure 4. Grid partition of subclasses (a) two-dimensional and (b) three-dimensional. For full color versions of the figures in this paper, please see the online version.
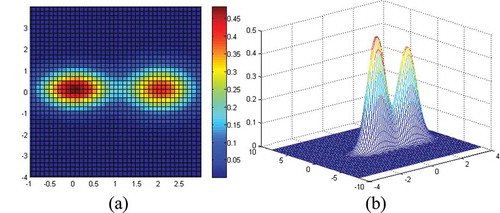
Table 1. The number, mean, covariance matrix, and label of simulated Gaussian data in numerical experiment.
Figure 5. Distribution of Gaussian data (a) original data and (b) data with supplementation. For full color versions of the figures in this paper, please see the online version.
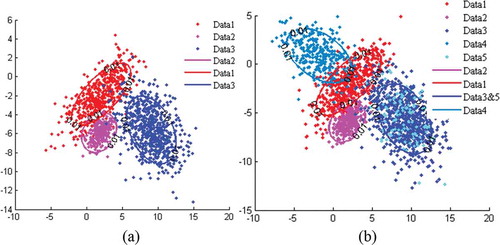
Table 2. AUSD learning result (number, mean, covariance matrix, and label) of original data.
Figure 6. Results of data density estimation for the first and second dimensions (a) data distribution histogram and the density estimation curve of original data, (b) data distribution histogram and the density estimation curve of data with supplementation, (c) isoprobability contour plots of original data and data with supplementation. For full color versions of the figures in this paper, please see the online version.
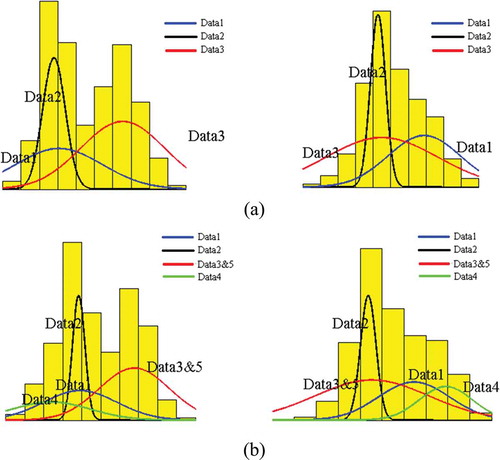
Table 3. AUSD Learning result (number, mean, covariance matrix, and label) of original data and supplementary data.
Figure 7. AUSD classification images of Groups A and B: (a) sub-image 1, (b) sub-image 2, (c) sub-image 3, (d) sub-image 4, (e) sub-image 5, (f) sub-image 6. Each sub-image is in the size of 300 × 300 pixels. For full color versions of the figures in this paper, please see the online version.
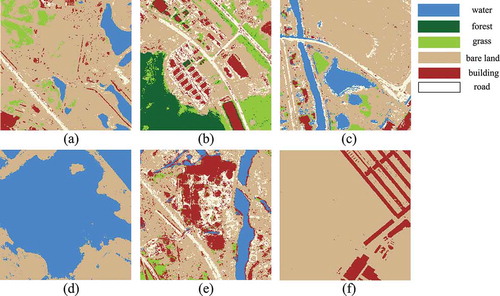
Figure 8. Preliminary images and final classification images of (a) proposed AUSD, (b) SVM, (c) MLC, (d) NB, (e) ELM, (f) FAM, (g) KNN, (h) DT. Each sub-image is in the size of 1000 × 1000 pixels. For full color versions of the figures in this paper, please see the online version.
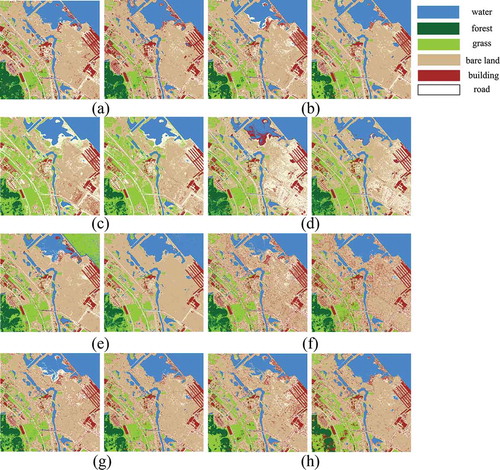
Table 4. Producer accuracies with Group A calibration set.
Table 5. Producer accuracies with Group A calibration set and Group B calibration set.
Table 6. The confusion matrix of AUSD of the entire image experiment.
Table 7. The confusion matrix of SVM of the entire image experiment.
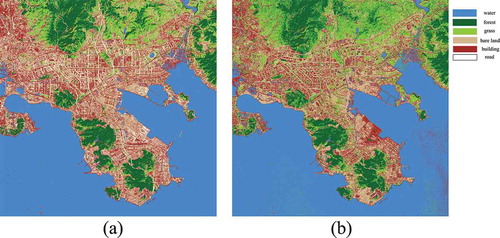
Figure 9. Classification images for the entire study area: (a) proposed AUSD, (b) SVM. Each image is in the size of 8000 × 8000 pixels. For full color versions of the figures in this paper, please see the online version.