Figures & data
Figure 1. The illustration of urban and near urban features and the characteristics of an urban landscape in the vegetation–impervious surface–soil (VIS) model (Ridd Citation1995). For full color versions of the figures in this paper, please see the online version.
Table 1. Fixed roughness length for momentum for surface coverage types in Kato and Yamaguchi (Citation2007).
Table 2. Fixed roughness length for momentum for surface coverage types in Weng et al. (Citation2013).
Figure 2. The location of the study area, Marion County, Indiana, USA, and the nine townships in Marion County.
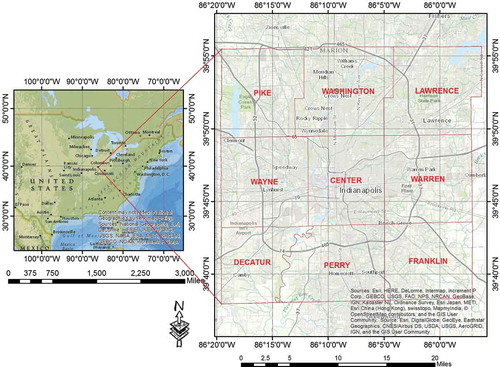
Figure 3. The flowchart of general methodology.
Table 3. Values according to LULC types for ground heat flux.
Figure 4. Fractions of vegetation, soil, and impervious surfaces in each pixel and the distribution of pure pixels. The fractions of vegetation and soil were from Landsat 8 acquired on DOY 249 (6 September), 281 (8 October), and 313 (9 November), 2013, and the fraction of impervious surface was from NLCD2011 data. The spatial resolution is 30 m.
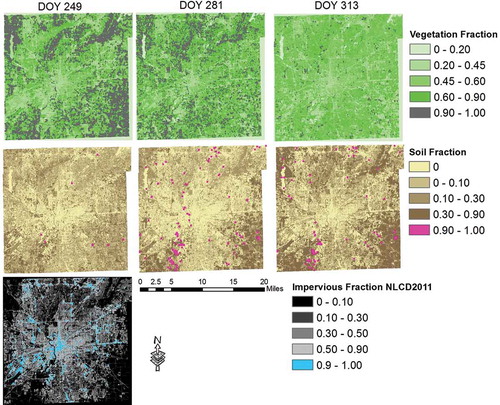
Figure 5. Displacement height (a) and roughness length (b) in meters from buildings.
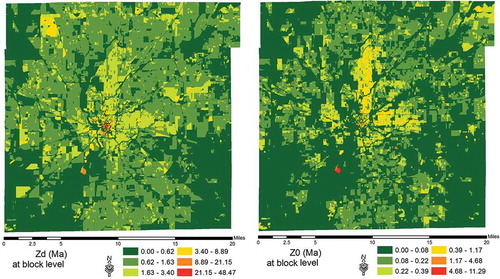
Figure 6. Hourly soil moisture (a) and hourly LE from soil, vegetation, and impervious surfaces (b) from 20 June to 30 June 2013.
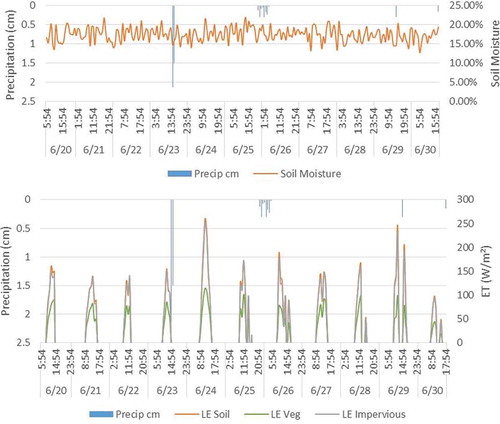
Figure 7. Daily soil moisture (a) and daily ET over vegetation, soil, and impervious surfaces (b) from September to November in 2013.
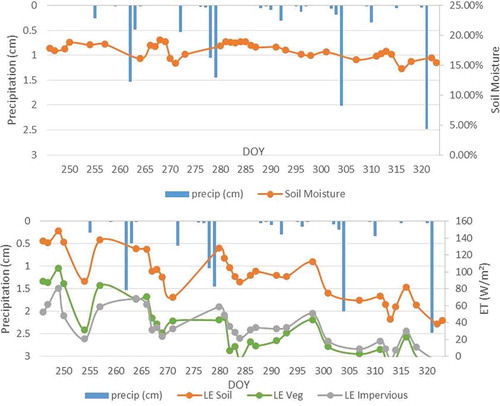
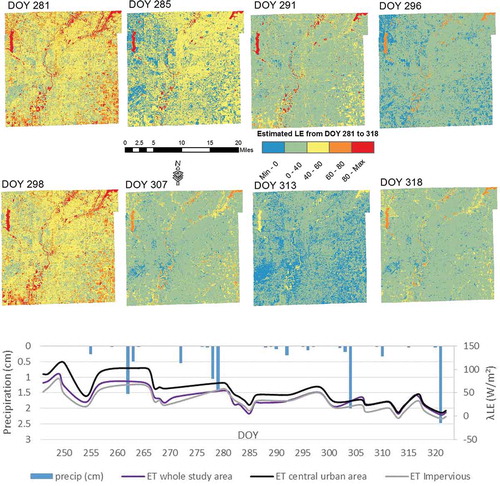
Figure 8. Spatial distribution of ET: (a) for the whole study area from DOY 281 to 318, 2013; (b) comparison between the central urban area and the city’s average.