
Figures & data
Figure 1. DMSP stable lights for the year 2012. For fullcolor versions of the figures in this paper, please see the online version.
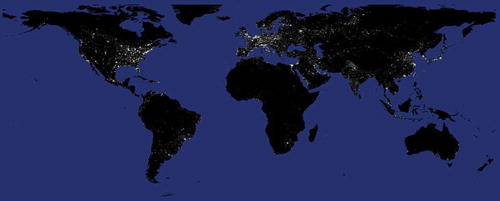
Figure 2. (a) 1992–2012 trend in ‘light per capita’ in the U.S.A. (measured in digital numbers); (b) Ratio of ‘light per capita’ in the U.S.A.’s neighbors over ‘light per capita’ in the U.S.A. Δli,x = 1 represents a perfectly equal distribution of ‘light per capita’ in the region.
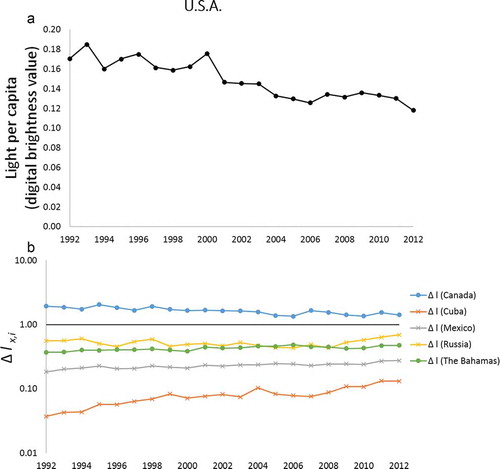
Figure 3. (a) 1992–2012 trend in “light per capita” in China (measured in digital numbers); (b) Ratio of “light per capita” in the China’s neighbors over “light per capita” in China. Δli,x = 1 represents a perfectly equal distribution of “light per capita” in the region.
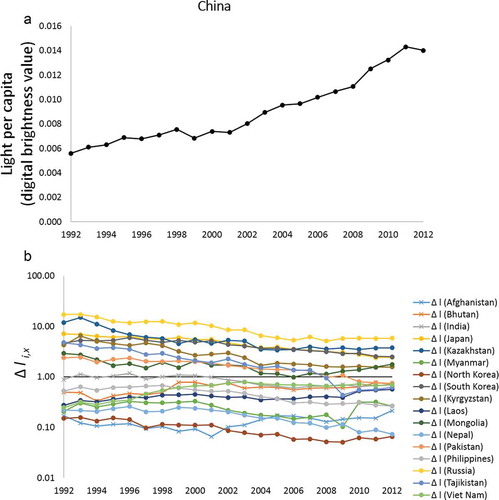
Figure 4. (a) 1992–2012 trend in “light per capita” in Afghanistan (measured in digital numbers); (b) Ratio of “light per capita” in the Afghanistan’s neighbors over “light per capita” in Afghanistan. Δli,x = 1 represents a perfectly equal distribution of “light per capita” in the region.
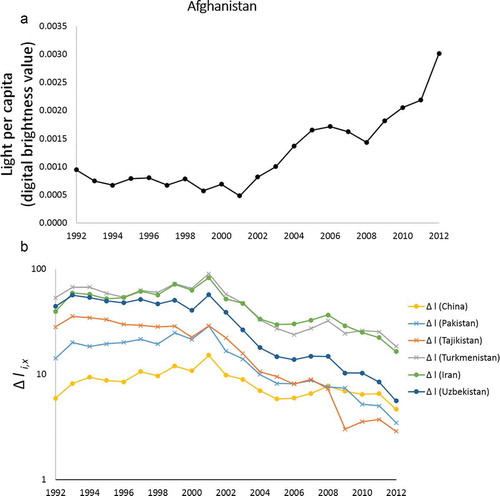
Figure 5. (a) 1992–2012 trend in “light per capita” in Angola (measured in digital numbers); (b) Ratio of “light per capita” in the Angola’s neighbors over “light per capita” in Angola. Δli,x = 1 represents a perfectly equal distribution of “light per capita” in the region.
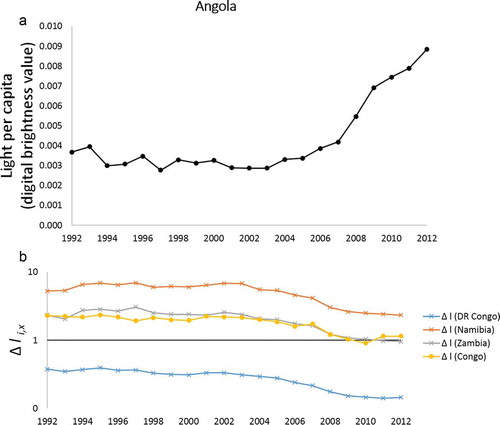
Figure 6. (a) 1992–2012 trend in “light per capita” in Sierra Leone (measured in digital numbers); (b) Ratio of “light per capita” in the Sierra Leone’s neighbors over “light per capita” in Sierra Leone. Δli,x = 1 represents a perfectly equal distribution of “light per capita” in the region.
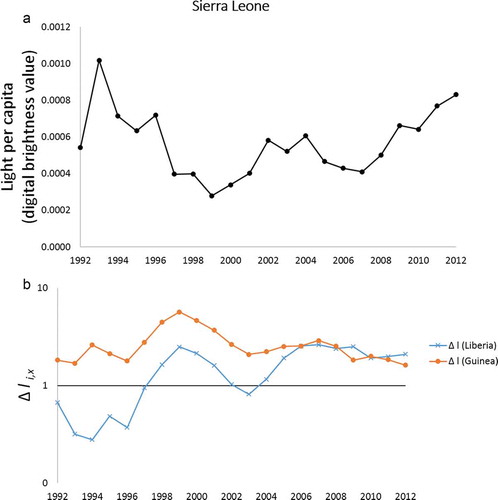
Figure 7. (a) 1992–2012 trend in “light per capita” in Somalia (measured in digital numbers); (b) Ratio of “light per capita” in the Somalia’s neighbors over “light per capita” in Somalia. Δli,x = 1 represents a perfectly equal distribution of “light per capita” in the region.
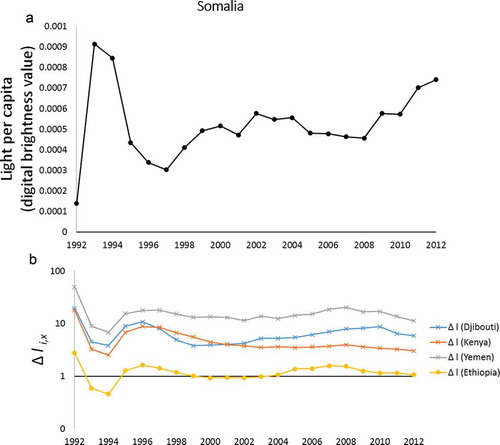
Figure 8. “Lights-index of regional disparity” in 200 countries of the world for the year 2012. Countries in yellow/orange/red have values of “light per capita” increasingly lower than their neighbor countries. Countries in green have values of “light per capita” higher than their neighbor countries.
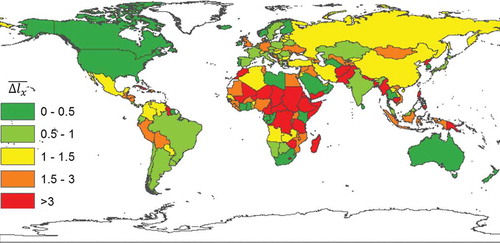
Table 1. List of countries characterized by a “lights-index of regional disparity” higher than 3.
Figure 9. North Korea /South Korea difference in emitted night-time light as detected by DMSP OLS for the year 2012. North Korea shows the highest value among 200 countries considered in this study.
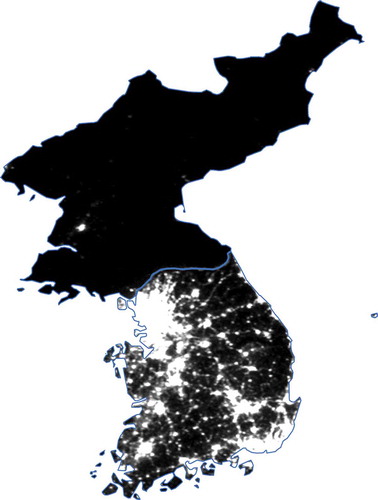
Figure 10. Scatterplot of the “lights-index of regional disparity” and the total number of occurring conflicts observed for the year 2012 in the 200 countries investigated. No relationship can be noted when these two variables are plotted together in a cross country analysis.
Figure 11. Average number of occurring conflicts versus the average “lights-index of regional disparity” in each one of the five categories of the index (as indicated above bars). Data refer to 2012. The total number of conflicts involving parties from a specific country as reported in the Conflict Barometer 2012 (HIIK Citation2012) has been considered as a measure of the level of conflict associated to that country. A linear regression line and the relative correlation coefficient show the relationship between the variables.
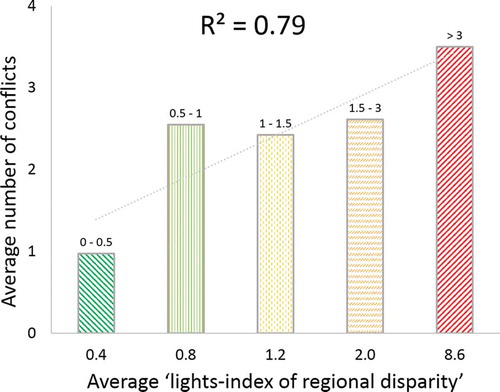
Table 2. Average value of the maximum difference observed between neighbor countries in each continent in 2012.
Figure 12. Change in the “lights-index of regional disparity” in 200 countries of the world from 1992 to 2012. Red regions are more unequal in 2012 than in 1992. Green regions are more equal in 2012 than in 1992. Yellow regions did not experience changes in the distribution of “light per capita” higher/lower than +0.1/-0.1.
