Figures & data
Figure 1. Map of the study area at Vinh Quang coast, Tien Lang district, Hai Phong city. For full color versions of the figures in this paper, please see the online version.
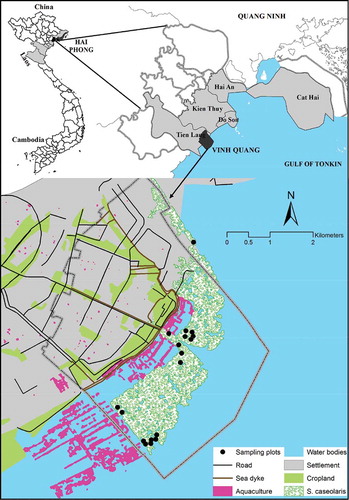
Table 1. Acquired satellite remote-sensing data.
Figure 2. Flowchart used to identify S. caseolaris using ALOS-2 PALSAR imagery.
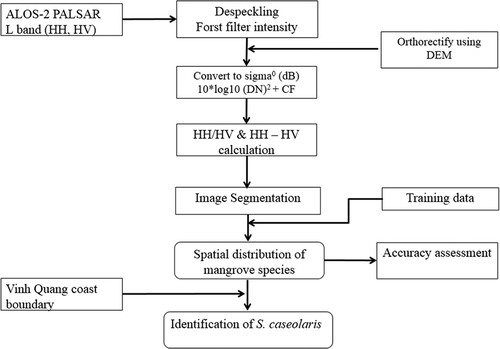
Figure 3. Measurement biophysical parameters of S. caseolaris and their roots.
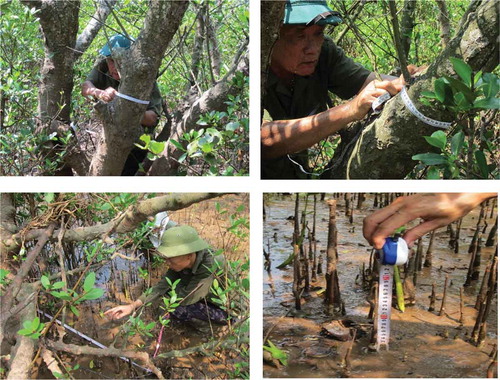
Figure 4. Structure of the MLPNN model for estimating the AGB in this study.
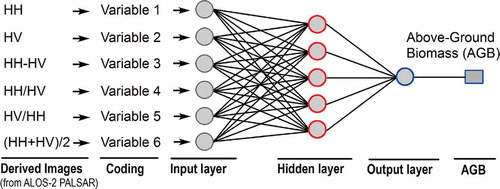
Table 2. Performance of MLPNN with different number of neurons in the hidden layer.
Table 3. Characteristics of S. caseolaris in the study site.
Table 4. Pearson’s correlation matrix of various biophysical parameters of S. caseolaris (N = 18).
Table 5. Person’s correlation matrix between backscattering coefficient σ° and various biophysical parameters of S. caseolaris (N = 18).
Table 6. Machine learning models with leave-one-out (LOO) cross-validation for estimation of above-ground biomass in this study.
Table 7. Comparison of MLPNN, SVR, RBFNN, GP, and RF models, using AIC and BIC.
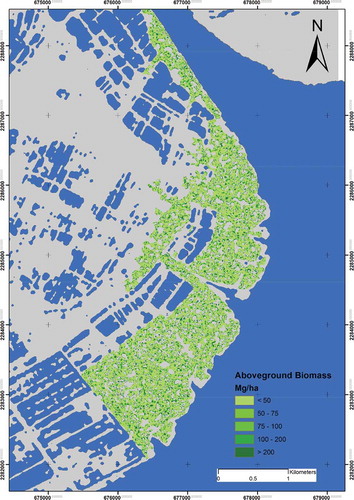
Figure 5. Spatial distribution pattern of biomass in the study area.