
Figures & data
Table 1. Forecast amounts of GDP and comparison with the NBSC’s GDP at the province level.
Table 2. Forecast amounts of GDP of the 23 urban agglomerations.
Table 3. Pearson’s correlation coefficients of GDP to sum light and sum lit population at the province level.
Table 4. Error rates of forecast GDP of 32 major Chinese cities for 2014.
Figure 1. The correlation between DN value of 2001 stable lights imagery and population density (Zhao Citation2014). For full colour versions of the figures in this paper, please see the online version.
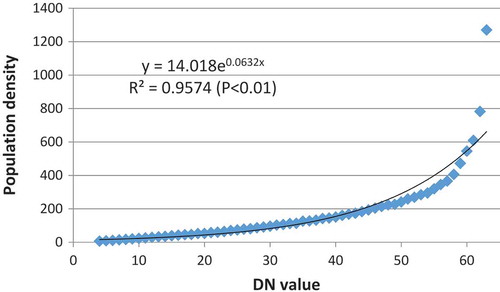
Figure 2. Forecast GDP maps for 2014 (a) and 2020 (b).
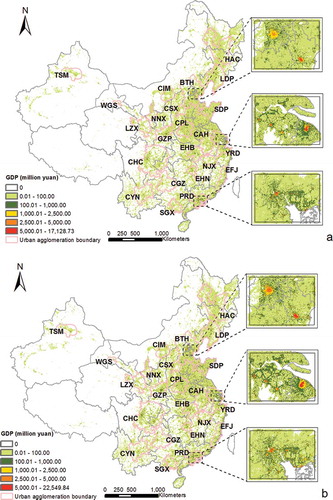
Table 5. Comparison with the IMF’s GDP at the national level.