Figures & data
Figure 1. Bi-temporal aerial frame image sets used in this study. (a and b) Hospital facility at morning and afternoon; (c and d) office park at morning and afternoon; (e and f) campus of San Diego State University during the afternoon with ~15 min between image acquisitions; and (g and h) a bridge overpass in Albuquerque, NM, imaged in the morning and afternoon. The top of each frame is oriented northward, except for (g) and (h), in which rightward is northward.
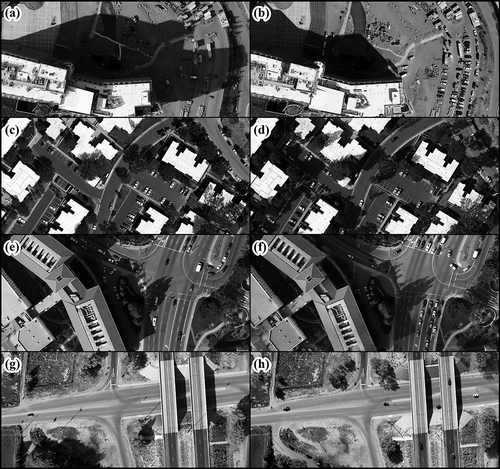
Figure 2. Examples of images associated with the transient shadow classification procedure. Transient shadows are visible in the intensity images at (a) time-1 and (b) time-2. This figure shows the time-2/time-1 ratios of (c) intensity (Iratio) and (d) intensity-normalized blue (B/Iratio), wherein higher values correspond to brighter areas in grayscale. Threshold classification of Iratio and B/Iratio images was used to derive (e) the bi-temporal transient shadow map. The clockwise arrangement of frames (a)–(e) reflects the workflow order.
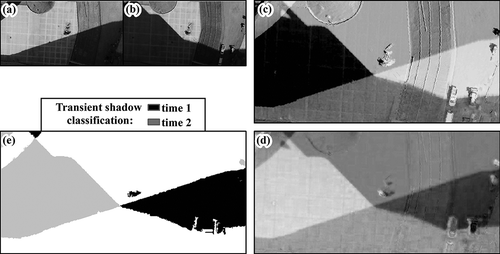
Figure 3. Illustration of the approach for deriving a hue/intensity ratio (H/I) classification threshold value based on the transient shadow region of an image: (a) histogram distribution of H/I pixels extracted from the transient shadow region, showing mean and standard deviation measures and (b) histogram of original H/I image and position of the threshold from (a) used to classify shadow pixels in the time-1 and time-2 images. Histograms (a) and (b) are from the hospital facility scene.
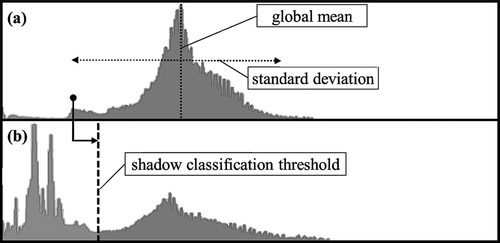
Table 1. Hue-intensity classification coefficients based on the mean (µ) and standard deviation (σ) of the transient shadow regions in each image.
Figure 4. Workflow diagram outlining the procedure for shadow classification used in this study. Items with dashed perimeters signify image data and classification products, linked to procedural step items with gray backgrounds and solid perimeters. Arrows indicate the flow of data.
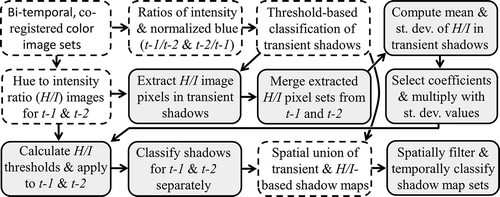
Table 2. Hue-to-intensity (H/I) threshold values used to classify shadows based on visual identification of the inter-modal inflection points, and those based upon statistics derived from the transient shadow regions.
Table 3. Summary statistics of shadowing effects on intensity and intensity-normalized blue for the paired pixel block samples, and spectral-radiometric differences observed in directly-illuminated areas of the image pairs. Bold, italicized values are compared with the Iratio and B/Iratio thresholds used in shadow classification: 0.9 and 1.1, respectively.
Figure 5. Bi-temporal shadow classification maps of the four study scenes, corresponding to (a) frames (a and b) (hospital facility), (b) frames (c and d) (office park), (c) frames (d and e) (university campus), and (d) frames (f and g) (bridge overpass) shown in Figure 1. The shadow maps shown were filtered using clump and sieve operations.
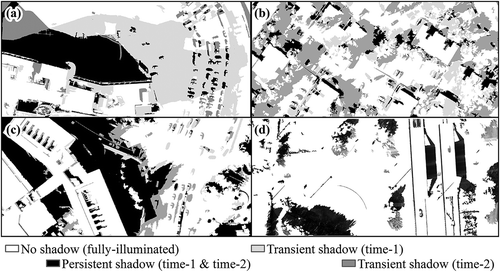
Table 4. Accuracy assessment results for (a) maps based on the Otsu thresholding approach and (b) maps based on the novel approach evaluated in this study.
Figure 6. Comparison of intensity image difference products based on the normalized versus original intensity images. The original intensity images at (a) time-1 and (b) time-2 were subtracted to generate (c) a difference image, wherein neutral (no or little change) is gray while black and white shades represent high negative and positive intensity changes, respectively. The frames labeled (d) and (e) represent the time-1 and time-2 intensity images, which were normalized in transient shadow areas, and frame (f) shows their arithmetical difference.

Figure 7. Magnified subsets of the intensity and arithmetical difference products, based on normalized versus original intensity images. The subsets are located within the (a) hospital facility, (b) office park, (c) bridge overpass, and (d) university campus scenes. Subset images are co-organized as: [1] original intensity image at time-1 and [2] time-2 used to generate [3] an arithmetical difference image; subsets [4] and [5] represent the time-1 and time-2 intensity images which were normalized in transient shadows, and [6] their arithmetical difference. Neutral (no or little change) is gray while black and white shades represent negative and positive changes, respectively.
![Figure 7. Magnified subsets of the intensity and arithmetical difference products, based on normalized versus original intensity images. The subsets are located within the (a) hospital facility, (b) office park, (c) bridge overpass, and (d) university campus scenes. Subset images are co-organized as: [1] original intensity image at time-1 and [2] time-2 used to generate [3] an arithmetical difference image; subsets [4] and [5] represent the time-1 and time-2 intensity images which were normalized in transient shadows, and [6] their arithmetical difference. Neutral (no or little change) is gray while black and white shades represent negative and positive changes, respectively.](/cms/asset/3a231358-3d80-4f17-a274-ea1329f7d0b5/tgrs_a_1279729_f0007_b.gif)
