Figures & data
Figure 1. Overall methodology of the study. For full colour versions of the figures in this paper, please see the online version.
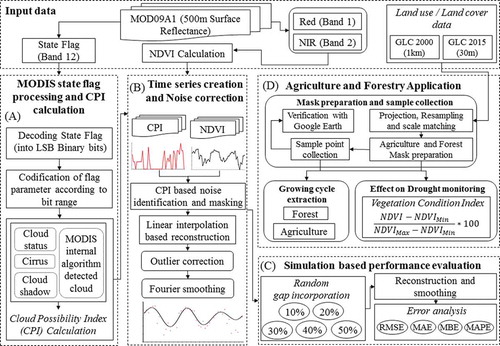
Table 1. Attribute class rating in MODIS 500-m state flag (16 bit).
Figure 2. Graphical representation of time-series NDVI and CPI values extracted from MODIS 500 m data of 2014: (a) time-series NDVI, (b) time-series CPI, and (c) relationship between time-series NDVI and CPI values.
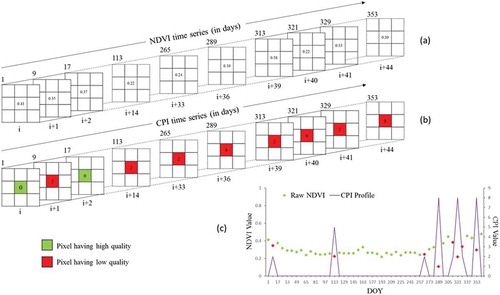
Table 2. Six cloud noise detection conditions used in the study.
Figure 3. Simulated annual NDVI profile having different percentages of random gaps: (a) 10%, (b) 20%, (c) 30%, (d) 40%, and (e) 50%
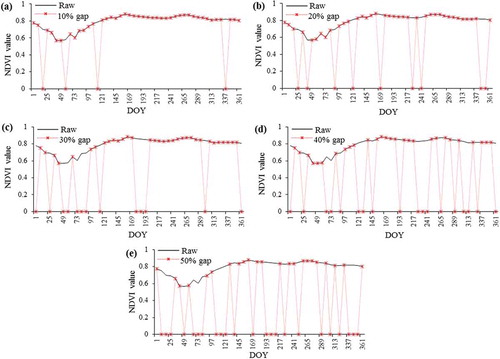
Figure 4. Spatial distribution of cloud-related parameters over Sri Lanka (25th composite of h25v08 and h26v08 MODIS tiles).
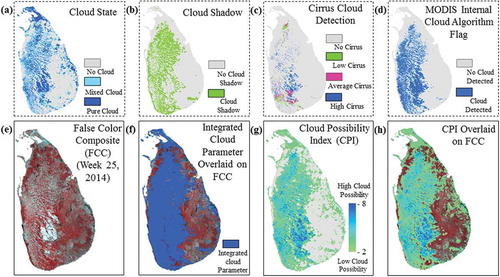
Figure 5. Graphical example of different threshold level over (a) natural vegetation and (b) agriculture.
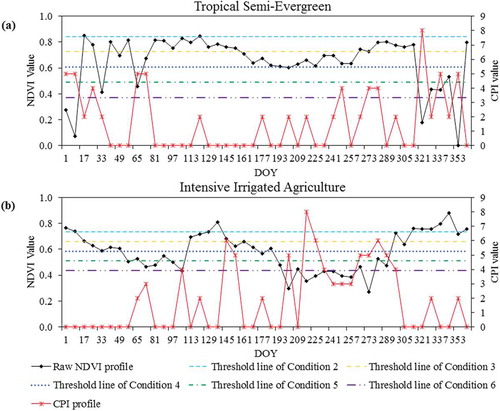
Figure 6. Raw NDVI and smoothed NDVI profile (based on different conditions) for (a) tropical dry evergreen forest, (b) tropical moist semi-evergreen forest, (c) tropical moist deciduous forest, (d) tropical dry deciduous forest, (e) rain-fed crop (single growing cycle), (f) intensive irrigated crop (double growing cycle), and (g) intensive irrigated crop (triple growing cycle).
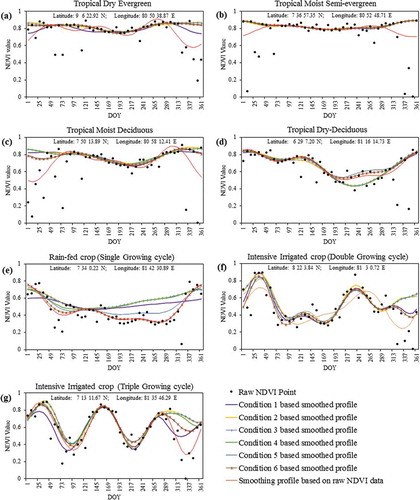
Table 3. Reconstruction model error statistics (RMSE, MAE, MBE, and MAPE) for five gap levels (10%, 20%, 30%, 40%, and 50%).
Figure 7. Mean bias error (MBE) distribution and error statistics from simulated annual profiles with (a) 10% gap, (b) 20% gap, (c) 30% gap, (d) 40% gap, and (e) 50% gap.
Figure 8. Spatial distribution of MODIS FCC, raw NDVI and corrected NDVI (based on TBC 3) of different composites of different months: (a) 2nd (2nd week of January), (b) 6th (2nd week of February), (c) 10th (2nd week of March), (d) 14th (2nd week of April), (e) 17th (2nd week of May), (f) 21st (2nd week of June), (g) 25th (2nd week of July), (g) 29th (2nd week of August), (i) 33rd (2nd week of September), (j) 37th (2nd week of October), (k) 40th (2nd week of November), and (l) 44th composite (2nd week of December).
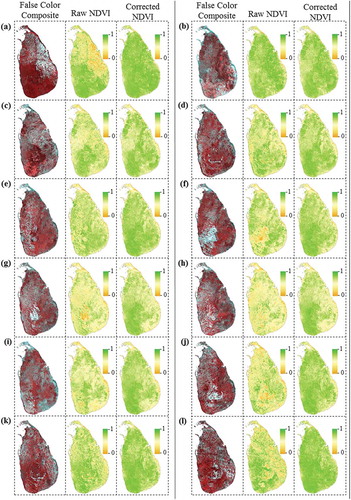
Table 4. Sampling based performance evaluation of different TBCs results in estimating number of growth cycles in natural vegetation.
Figure 9. The spatial distribution of extracted growing cycle in forested region based on smoothed results from (a) TBC 1, (b) TBC 2, (c) TBC 3, (d) TBC 4, (e) TBC 5, (f) TBC 6, and (g) without CPI.
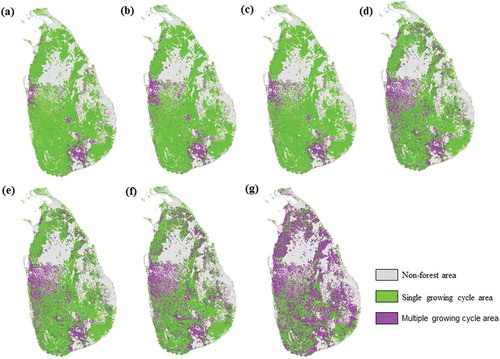
Figure 10. The spatial distribution of number of growing cycle in agricultural region based on smoothed results from (a) TBC 1, (b) TBC 2, (c) TBC 3, (d) TBC 4, (e) TBC 5, (f) TBC 6, and (g) without CPI.
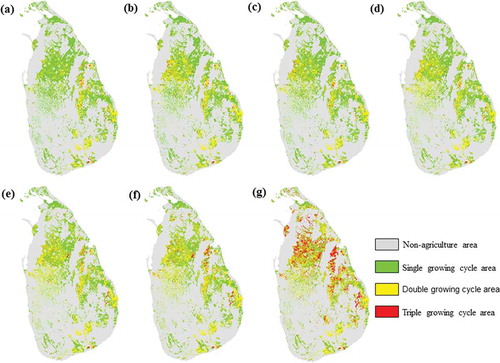
Table 5. Performance evaluation of different TBCs result based on number of growth cycles in heterogeneous agriculture samples.
Table 6. Performance evaluation of different TBCs result based on number of growth cycles in homogeneous agriculture samples.
Figure 11. Spatial distribution of cloud corrected VCI and non-cloud corrected VCI over Sri Lanka for (a) 2nd week of July, (b) 3rd week of July, (c) 4th week of July, (d) 1st week of August, (e) 2nd week of August, and (f) 3rd week of August in 2014.
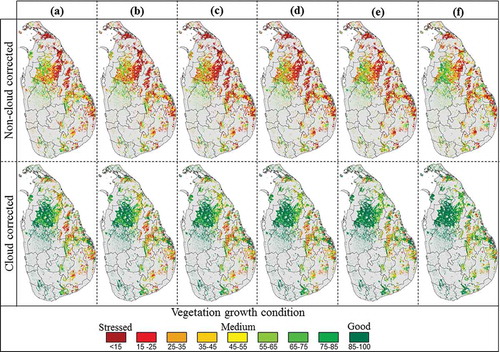
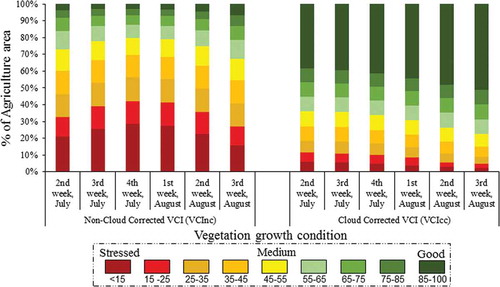
Figure 12. Class-wise % of agriculture area extracted using cloud-corrected VCI and non-cloud-corrected VCI over Sri Lanka for six continuous weeks from 2nd week of July to 3rd week of August, 2014.