Figures & data
Figure 1. Map of the study area in California. The yellow polygon represents the spatial extent of the study, while the hashed boxes represent the footprint of the Landsat 8 OLI imagery. The green polygons represent the boundary of the national forests in the region. The lower inset shows the elevation contours (blue:500 m; yellow:1500 m; and red:2000 m). For full colour versions of the figures in this paper, please see the online version.
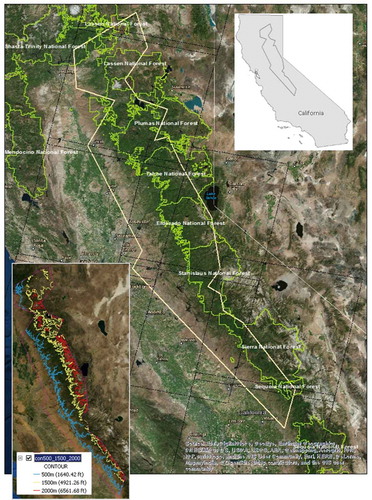
Figure 2. Important linear relationship of soil line and the vegetation response in the NIR-Red feature space used in the MPDI algorithm (Source: Ghulam et al., Citation2007a).
Figure 3. Workflow routine for implementation of the Modified Perpendicular Drought Index.
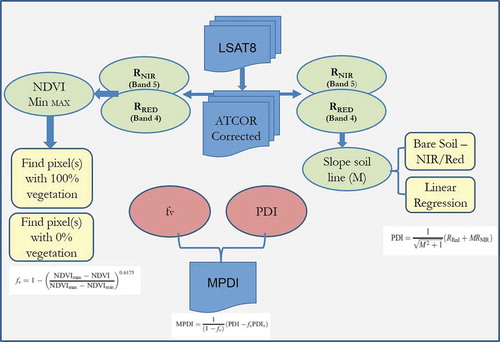
Figure 4. Bare areas classification output (blue patches) that was used to derive the soil line for an example image tile (Lake Tahoe region). The plots show soil line plots extracted based on sampling the bare areas in each of the Landsat image tiles covering the study area.
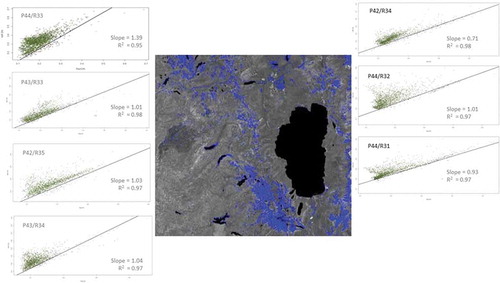
Figure 5. Spatial model illustrating the calculation of the MPDI algorithm using the Landsat spectral bands and the soil parameter. The top chain of the model calculates the vegetation fraction and shunts it to the lower chain where the MPDI is calculated to output a raster grid.
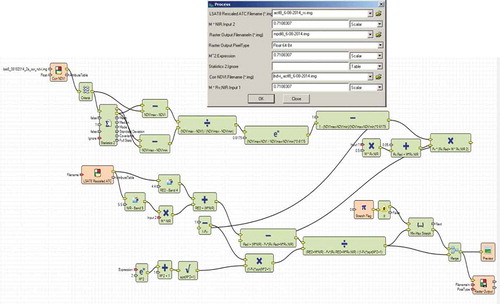
Figure 6. Vegetation stress mapped using the MPDI along with the percent area covered (insert chart) for the study area.
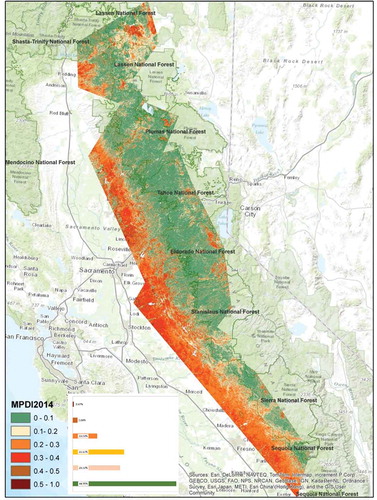
Figure 7. Forest types mapped using 2014 summer Landsat8 data.
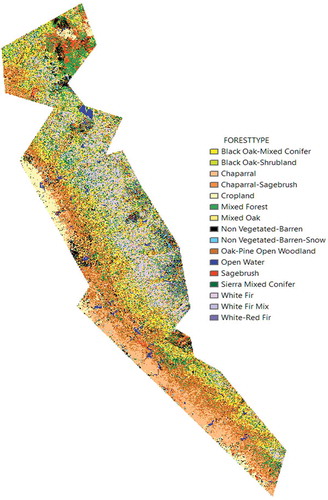
Figure 8. The distribution of MPDI values for the mapped forest types in the study area.
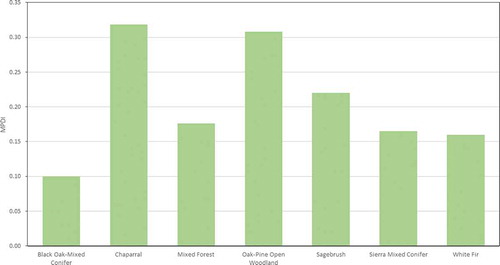
Figure 9. Regression analysis fitting the Mean CWD (a) to the Mean MPDI (b) for the different forest types in the study area.
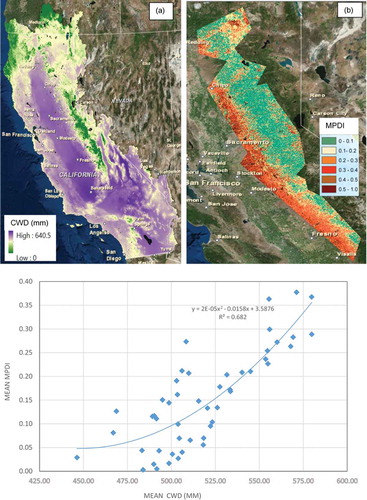
Figure 10. Distribution of the CWD anomaly of summer 2014 data from historical 30-year summer mean.
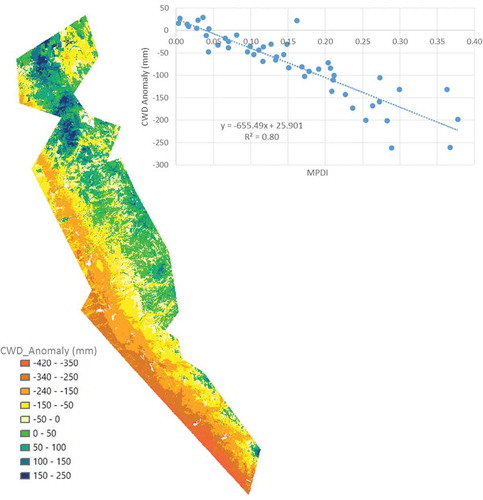
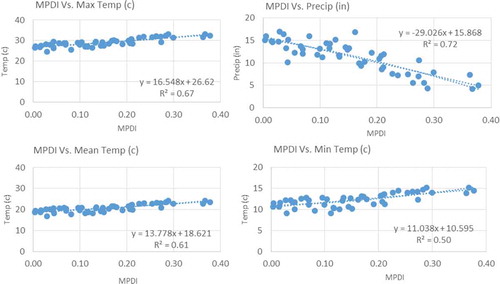
Figure 11. MPDI relationship to weather variables.