Figures & data
Figure 1. (a) Locations of the two study sites. (b) True-color images of the two study sites: An unmanned aerial vehicle image of a paddy rice field at Chonnam National University (CNU), Gwangju, and a RapidEye image of TaeAn, South Chungcheong Province, Korea. (c) A digitized rice paddy cover map of TaeAn.
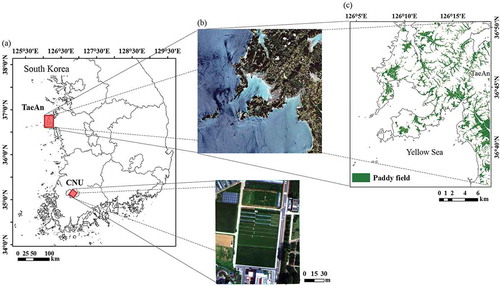
Table 1. GRAMI-rice model parameters for simulation at both the field and regional scales.
Table 2. Pearson’s correlation coefficients (r) and linear regression equations between unmanned aerial vehicle (UAV)-based digital numbers (y) and CROPSCAN reflectance values (x) for wavelengths of interest at different dates during the growing season in 2013.
Table 3. Specifications of the RapidEye satellite system.
Figure 2. Schematic representation of crop growth mapping using the GRAMI-rice model. NDVI, LAI, and AGDM represent normalized difference vegetation index, leaf area index, and above-ground dry mass, respectively.
Figure 3. Time series maps (a–e) of the normalized difference vegetation index (NDVI) of paddy rice fields at Chonnam National University, Gwangju, Korea, in 2013. The NDVI maps were generated for several days of the year (DOY): (a) DOY 172, (b) DOY 192, (c) DOY 206, (d) DOY 220, and (e) DOY 233.
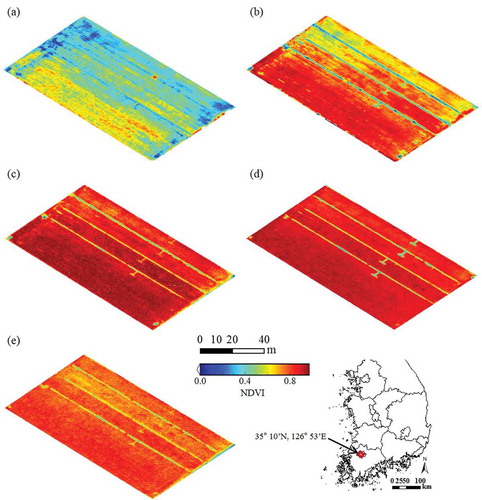
Figure 4. Time series maps (a–d) of the normalized difference vegetation index (NDVI) of classified paddy rice fields at TaeAn, South Chungcheong Province, Korea, in 2010. The NDVI maps were generated for several days of the year (DOY): (a) DOY 152, (b) DOY 174, (c) DOY 220, and (d) DOY 250.
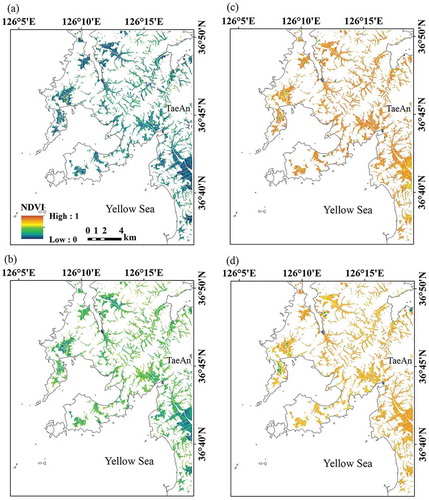
Table 4. Error statistics (root mean square error, RMSE, mean absolute error, MAE, and model efficiency, ME) for comparisons between simulated and measured normalized difference vegetation index (NDVI), leaf area index (LAI), and above-ground dry mass (AGDM) values under nitrogen applications of 0, 50, and 115 kg ha−1 at Chonnam National University, Gwangju, Korea, in 2013.
Figure 5. Simulated and measured values of normalized difference vegetation index (NDVI), leaf area index (LAI), and above-ground dry mass (AGDM) of paddy rice during the growing season in 2013 at Chonnam National University, Gwangju, Korea, under nitrogen (N) applications of 0, 50, and 115 kg ha−1. The data points and vertical error bars represent the mean measured values ±1 SE (n = 4).
Figure 6. Comparison of simulated and measured grain yields of paddy rice during the growing season in 2013 at Chonnam National University, Gwangju, Korea, under nitrogen (N) applications of 0, 50, and 115 kg ha−1. The p values were obtained from paired t-tests (α = 0.05). The vertical error bars represent ±1 SE of the simulated and measured mean values (n = 3).
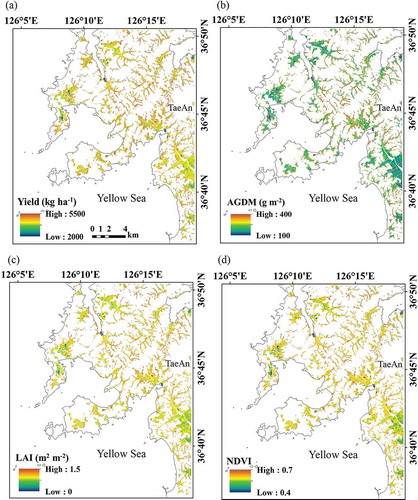
Figure 7. Maps of (a) grain yield; (b) above-ground dry mass, AGDM; (c) leaf area index, LAI; and (d) normalized difference vegetation index, NDVI, of classified paddy fields in TaeAn, South Chungcheong Province, Korea, at 57 days after transplanting in 2010.