
Figures & data
Figure 1. Sample site locations of range reference areas within the grassland of the south-central interior of British Columbia, Canada. For full colour versions of the figures in this paper, please see the online version.
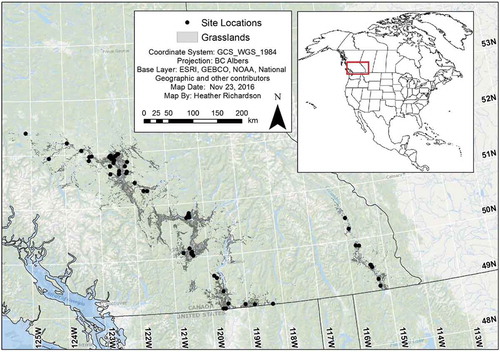
Table 1. GIS for soil carbon modeling and mapping.
Table 2. Stepwise regression for 2014 soil carbon in grazed and non-grazed systems comparing Normalized Difference Vegetation Index derived from MODIS (NDVIMODIS) and the multispectral radiometer (NDVIMSR).
Table 3. Random forest for 2014 soil carbon in grazed and non-grazed systems comparing normalized difference vegetation index derived from MODIS (NDVIMODIS) and the multispectral radiomete(NDVIMSR).
Figure 2. Predicted soil carbon (SC) percentage in the top 10 cm of the soil column based on stepwise regression (SR) and random forest (RF) models: (a) SR grazed 2014, (b) SR fenced (non-grazed) 2014, (c) RF grazed 2014, (d) RF fenced (non-grazed) 2014.
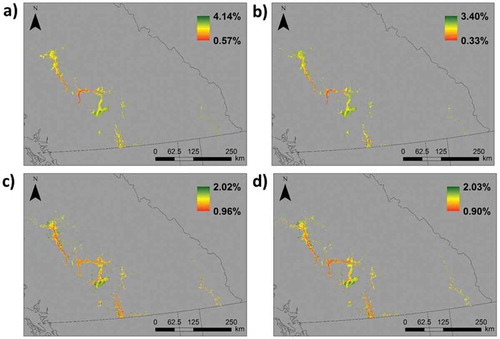
Table A Range Reference Area (RRA) sites used for soil sampling