Figures & data
Figure 1. Study area: Nanjing, China has 11 districts with approximately 6500 taxis in daily operation. For full color versions of the figures in this paper, please see the online version.
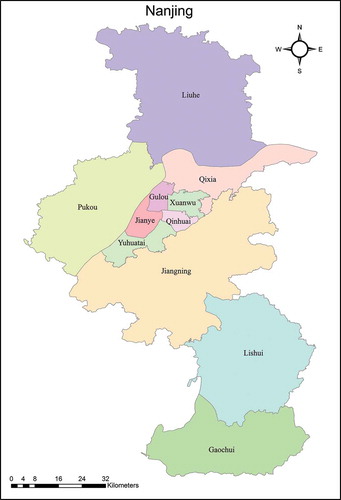
Figure 2. Extraction of passenger pickup locations and drop-off locations from FCD.
Figure 3. Road nodes and their Thiessen polygons of Nanjing. For full color versions of the figures in this paper, please see the online version.
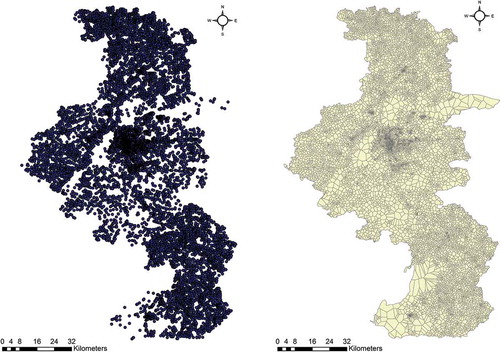
Figure 4. The number of pickup locations and drop-off locations over time. (a) The number of pickup locations and drop-off locations each day; (b) The number of pickup locations and drop-off locations each hour. For full color versions of the figures in this paper, please see the online version.
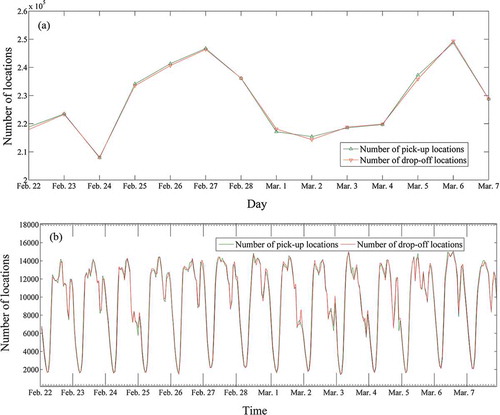
Figure 5. Spatial distribution of the pickup and drop-off locations. (a) Spatial distribution of the pickup locations from 22 February to 28 February; (b) Spatial distribution of the pickup locations from 1 March to 7 March; (c) Spatial distribution of the drop-off locations from 22 February to 28 February; (b) Spatial distribution of the drop-off locations from 1 March to 7 March. For full color versions of the figures in this paper, please see the online version.
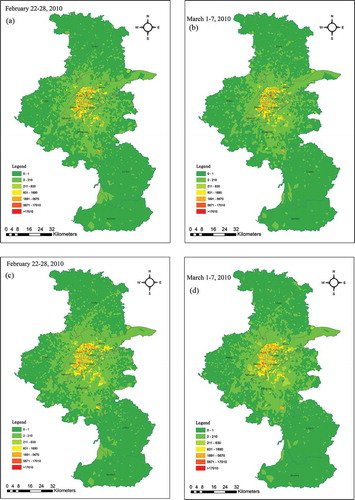
Figure 6. Hot spot analysis of the pickup and drop-off locations. (a) Hot spot analysis of pickup locations from 22 February to 28 February; (b) Hot spot analysis of pickup locations from 1 March to 7 March; (c) Hot spot analysis of drop-off locations from 22 February to 28 February; (d) Hot spot analysis of drop-off locations from 1 March to 7 March. For full color versions of the figures in this paper, please see the online version.
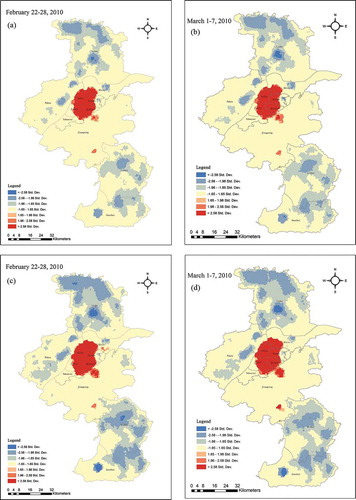
Figure 7. Spatial and temporal distributions of pickup and drop-off locations on 3 March during some typical periods. (a) Spatial and temporal distributions of pickup locations; (b) Spatial and temporal distributions of drop-off locations. For full color versions of the figures in this paper, please see the online version.
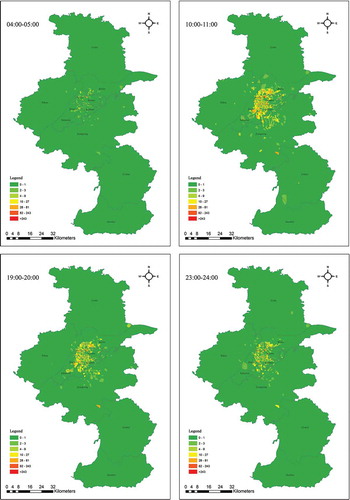
Figure 7. (Continued)
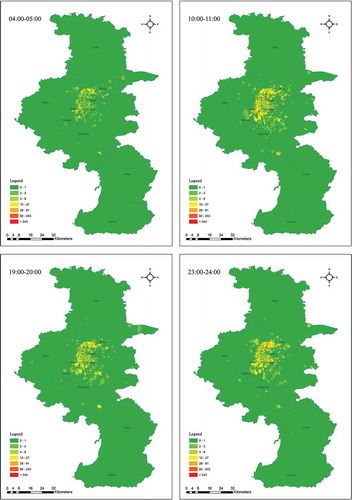
Figure 8. Taxi-passing map on 3 March during some typical periods. For full color versions of the figures in this paper, please see the online version.
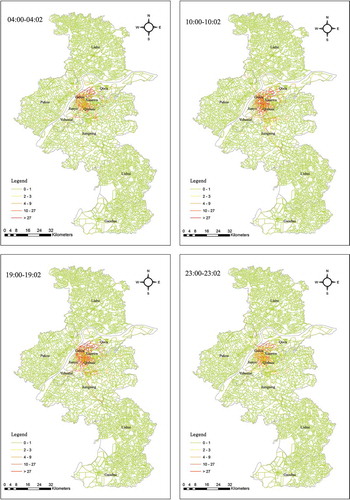
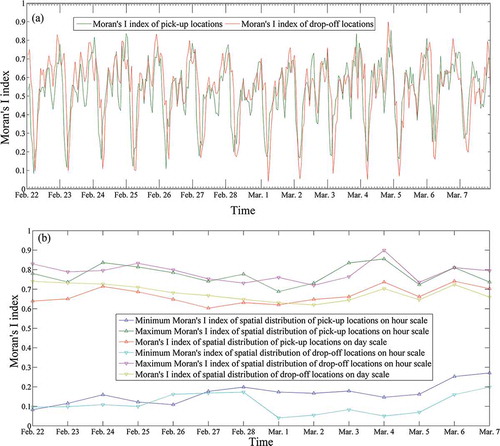
Figure 9. Changes in the Moran’s I index over time. (a) Moran’s I index of spatial distribution of pickup and drop-off locations changes by hour; (b) Comparative analysis of minimum and maximum Moran’s I index values on hourly and daily scales. For full color versions of the figures in this paper, please see the online version.