
Figures & data
Figure 1. Study areas (false color images of Landsat 8 for the year 2014).
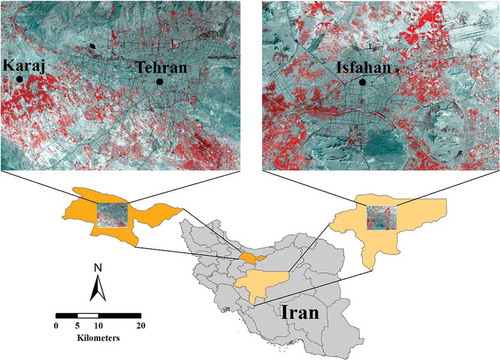
Table 1. Variables used for urban growth simulation.
Figure 2. Workflow showing the LTM-based urban change simulation using a top-down approach and cellular automata.
Table 2. Spatial metrics used for model evaluation (Pontius et al. Citation2008).
Figure 3. Error maps for Tehran (a) LTM-CA with a 3 × 3 neighborhood size, (b) LTM-CA with a 5 × 5 neighborhood size, (c) LTM-CA with a 7 × 7 neighborhood size, (d) LTM-CA with a 9 × 9 neighborhood size, and (e) LTM with a top-down approach. The maps show the levels of agreement and disagreement between the simulated and reference maps.
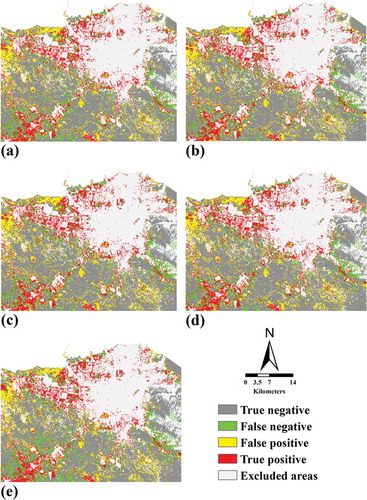
Figure 4. Error maps for Isfahan (a) LTM-CA with a 3 × 3 neighborhood size, (b) LTM-CA with a 5 × 5 neighborhood size, (c) LTM-CA with a 7 × 7 neighborhood size, (d) LTM-CA with a 9 × 9 neighborhood size, and (e) LTM with a top-down approach. The maps show the levels of agreement and disagreement between the simulated and reference maps.
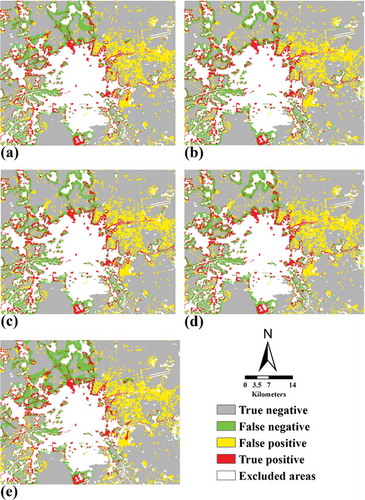
Figure 5. The difference between the LTM with a top-down approach (a, A1, B1, C1, D1, and E1) and LTM-CA with 7 × 7 neighborhood size (b, A2, B2, C2, D2, and E2) for Tehran.
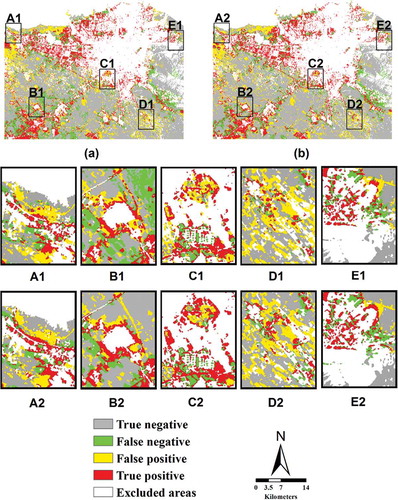
Figure 6. The difference between the LTM with a top-down approach (a, A1, B1, C1, D1, and E1) and LTM-CA with 7 × 7 neighborhood size (b, A2, B2, C2, D2, and E2) for Isfahan.
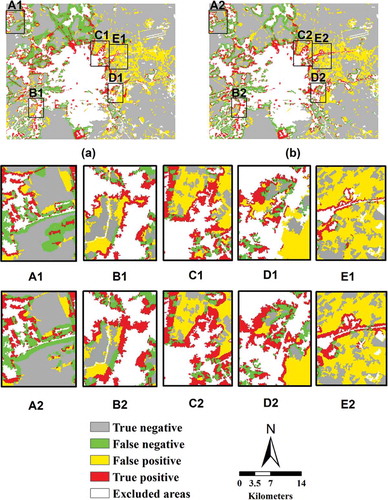
Table 3. Accuracy assessment of the models indicated by the FOM, OA, and PA.