Figures & data
Figure 1. Spatial location of (a) Gujarat within India, (b) districts of Gujarat and location of the nine meteorological stations selected for the study. For full color versions of the figures in this paper, please see the online version.
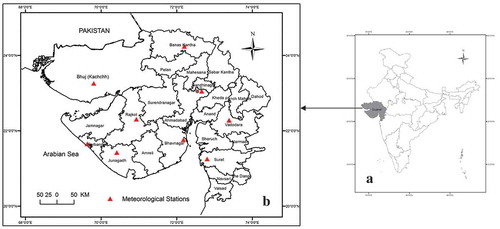
Figure 2. (a) Isohyetal map showing long-term (1981–2010) mean monsoonal rainfall, and (b) isothermal map showing long-term (1981–2010) mean maximum temperature during the monsoon season.
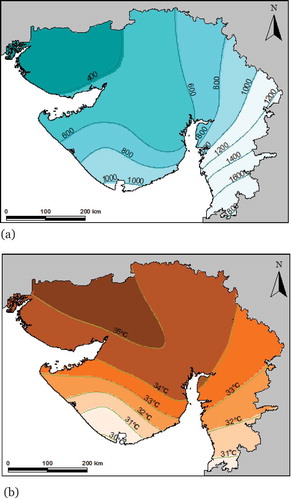
Table 1. Classification of the VCI, TCI and VHI and corresponding color schemes to depict, respectively, moisture-stress, thermal stress and vegetation health.
Figure 3. Classified map of land-use/land-cover of Gujarat obtained from 30-m resolution GLC30 (Citation2010) images.
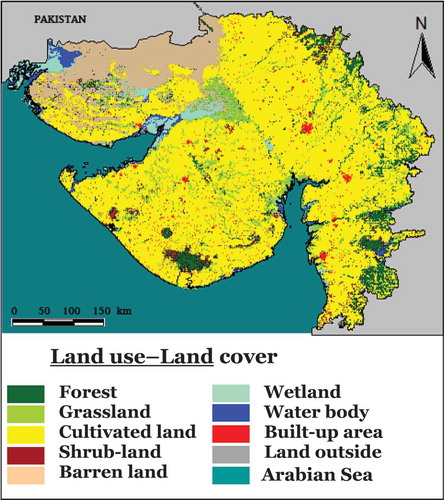
Table 2. Various ranges of the SPI (McKee, Doesken, and Kleist Citation1993) depicting meteorological drought severity and corresponding color schemes (Bhuiyan et al. Citation2006) used in this study.
Table 3. Results of the multiple-regression depicting relative influence of number of heat-wave days (HWD) and monsoon rainfall (PMON) on average temperature during the monsoon season (TMON) at selected meteorological stations in Gujarat.
Table 4. Meteorological drought-years, agricultural drought-years (a), and the years with above-normal temperature (ANT) in Gujarat (shown as Y).
Figure 4. Frequency plot showing variation of the VCI values in the background of gradual variation of mean maximum aboveground air-temperature during the monsoon season.
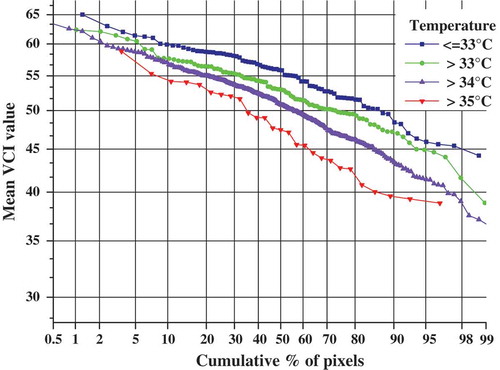
Figure 5. Attenuation of the impact of moisture-stress by favorable thermal state in vegetation.
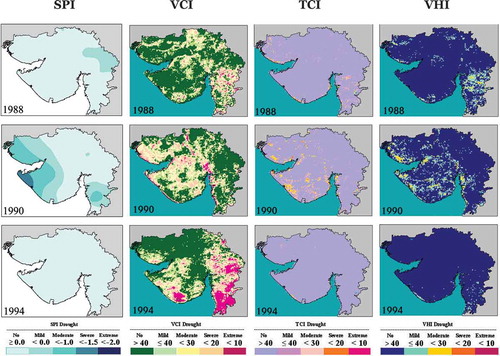
Figure 6. Drought intensification due to the impact of thermal stress in vegetation.
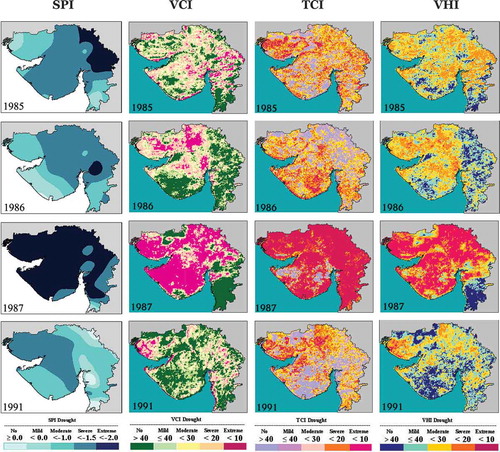
Figure 7. Degradation of vegetation health and development of vegetative drought mainly due to thermal stress.
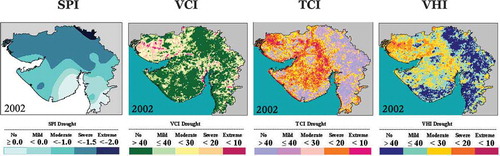
Table 5. Correlation of the SPI, VCI and TCI with the VHI in the years of vegetative drought and non-drought in Gujarat during 1981–2010.
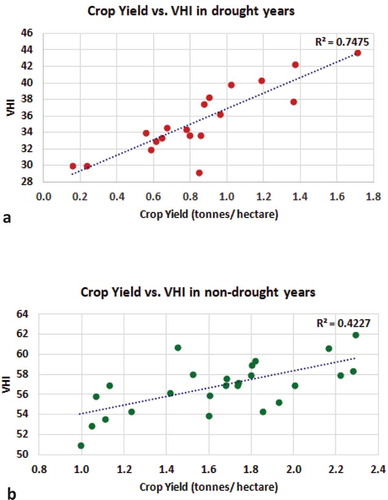
Figure 8. Scatter-plot showing variation of VHI against crop yield (CY) in Gujarat during 2001–2010: (a) in the drought years; (b) in the non-drought years.