Figures & data
Figure 1. Location of the study area in West-Central Alberta. For full color versions of the figures in this paper, please see the online version.
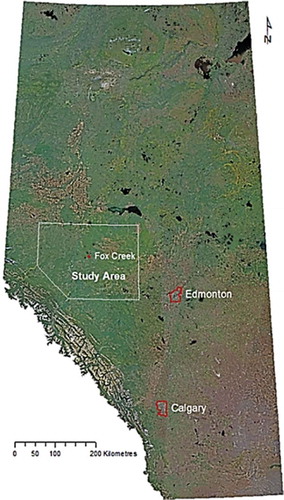
Figure 2. Processing steps to select ground-reference data for target year.
Figure 3. Extraction and refinement process of anthropogenic footprints.
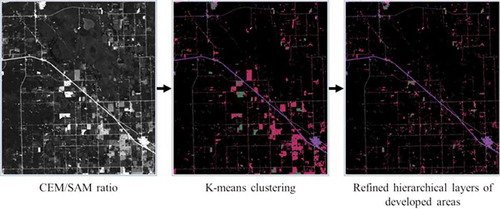
Figure 4. Work flow of fused classification map production.
Figure 5. Work flow for classifying year-to-year land disturbance and vegetation loss.
Figure 6. Agricultural zone and DIDs oil and gas footprints from 1970 to 2013 in the study area.
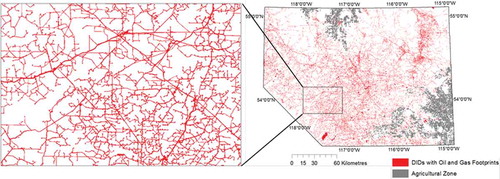
Figure 7. False color composite (SWIR 1, NIR, Red) of (a) 2005 and (b) 2006 Landsat annual BAP data. (c) Types of land disturbances and (d) types of vegetation loss from 2005 to 2006.
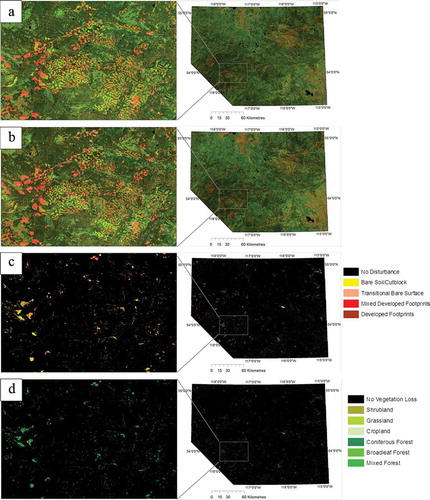
Figure 8. Area estimation of types of land disturbance from 2005 to 2013 including the contribution of oil and gas footprints.
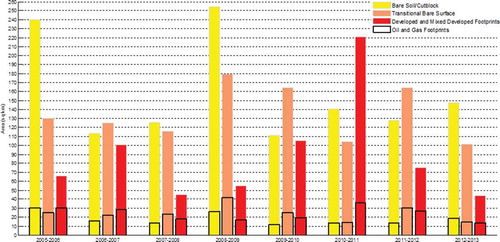
Figure 9. Area estimation of types of vegetation loss from 2005 to 2013 including the contribution of oil and gas footprints.
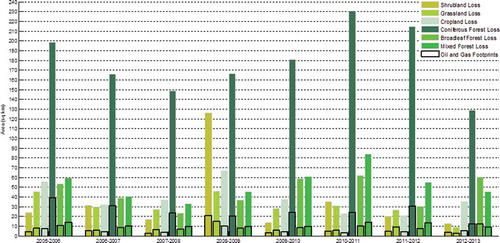
Figure 10. (a) Cumulative land disturbances from 2005 to 2013 and (b) the state of cumulative land disturbances including (c) oil and gas footprints in 2013 with remaining disturbances and evidence of vegetation recovery.
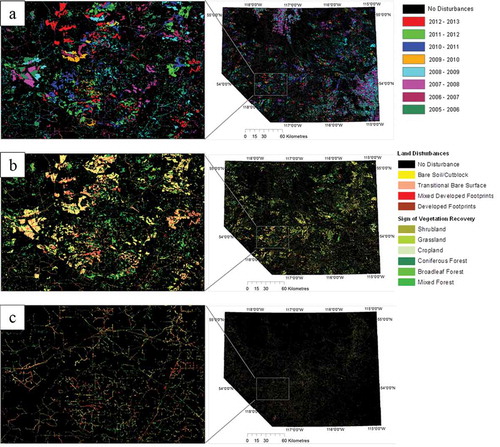
Figure 11. Area estimation of recovering and remaining disturbances in 2013 out of 2005–2013 cumulative land disturbances with the contribution of oil and gas footprints.
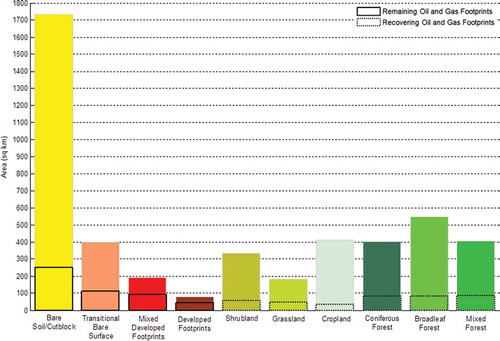
Table 1. Error matrix of cumulative land disturbances from 2005 to 2013.
Table 2. Jeffries-Matusita spectral separability measure ranked from least to most for pairs of selected training data from 2009.
Table 3. Error matrix of the 2009 LULC classification map.
Figure 12. (a) Producer’s accuracy and (b) overall accuracy of annual LULC classification map from 2005 to 2013.
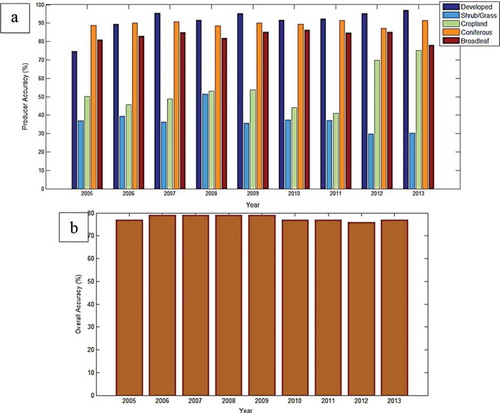
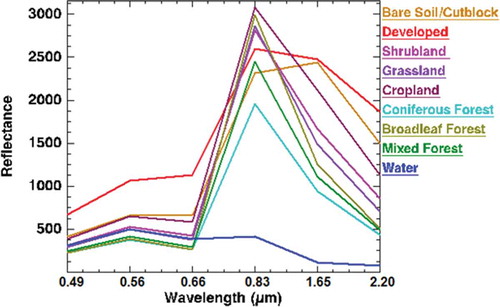
Figure 13. An example of spectral signatures of training data for 2009.