Figures & data
Figure 1. The spatial distribution maps of (a) Landsat image (band combination 7, 5, 3) and (b) land cover of China.
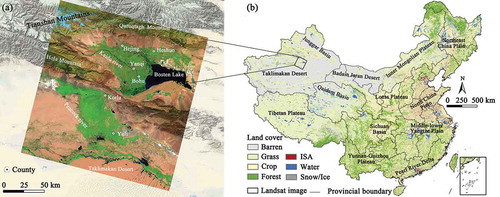
Figure 2. Triangular scatterplot of NDVI, TC1, and NDSI.
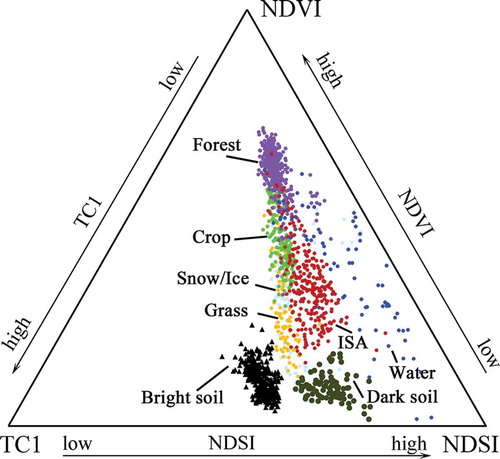
Figure 3. The scatterplot between (a) NDSI and TC1, (b) TC1 and NDVI from different land covers.
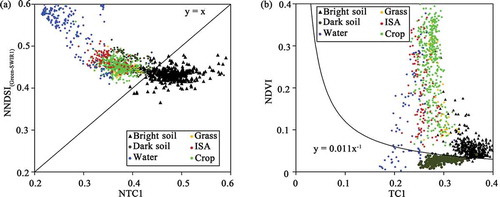
Figure 4. Spatial distribution maps of (a) Ratio Index for Bright Soil and (b) Product Index for Dark Soil from Landsat 8 images.
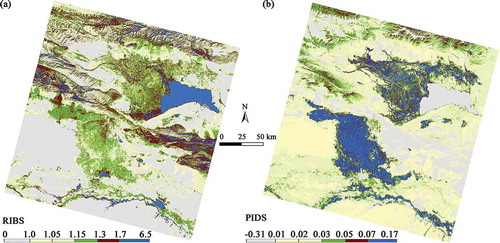
Figure 5. The boxplots of spectral indices of different land covers from Landsat 8 images: (a) RIBS; (b) PIDS.
Figure 6. Bivariate density-sliced histogram plots between (a) NNDSI (3–6) and NTC1, (b) NDVI and TC1.
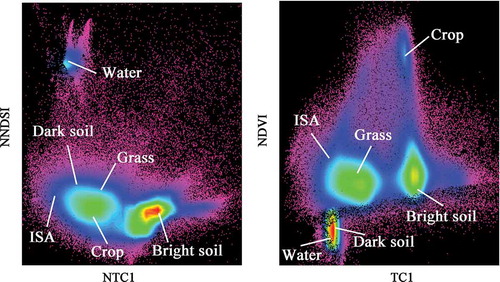
Table 1. SDI and JM distances of RIBS by Landsat image between different land covers.
Table 2. Results of SDI and JM distance from PIDS between different land covers.
Figure 7. The scatterplot between (a) NDSI(7–3) and TC1 and (b) boxplot of RNDSI of different land covers.
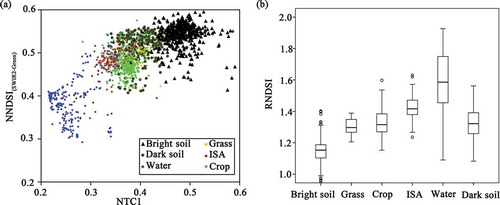
Table 3. Results of SDI and JM distance from RNDSI between different land cover types.
Figure 8. Spatial distribution maps of (a) Ratio Index for Bright Soil and (b) Product Index for Dark Soil from MODIS images.
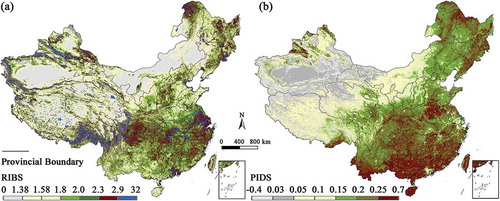
Figure 9. The boxplots of (a) RIBS and (b) PIDS for different land covers from MODIS images.
Table 4. The SDI and JM distances from RIBS estimated by MODIS images between different land covers.
Table 5. Results of SDI and JM distance from PIDS between different land covers.
Table 6. Accuracy assessments of MODIS-derived soil map in 2015 using reference data.
Figure 10. The scheme of the developed RIBS and PIDS.