
Figures & data
Figure 1. Location of the study area, overlap of Light Detection and Ranging (LiDAR) data and orthophoto, olive trees, and the terraces of the study area can be distinguished, sampled trees are in black.
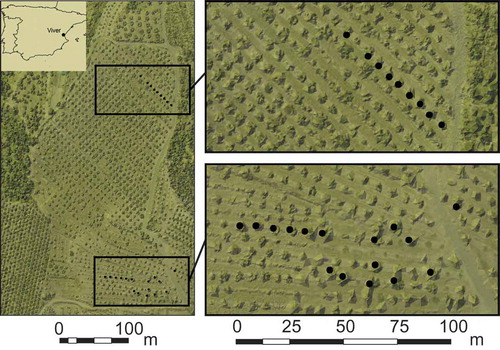
Table 1. ALS capture and instrument specifications.
Table 2. Basic statistics of measured tree parameters.
Figure 2. The processing scheme for tree crown delineation from the ALS point cloud.
Figure 3. Intermediate results of tree crown delineation for a part of the study area. a) normalized ALS, b) height filtration, c) α-shape segments and d) crown polygons.
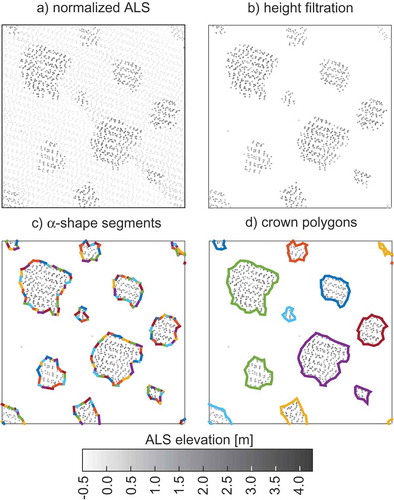
Figure 4. Algorithm for adjusting the alpha-shape algorithm to field measurements.
Figure 5. The processing scheme for the estimation of dendrometric parameters.
Figure 6. ALS points representing a tree: (a) original and (b) in the principal component domain.
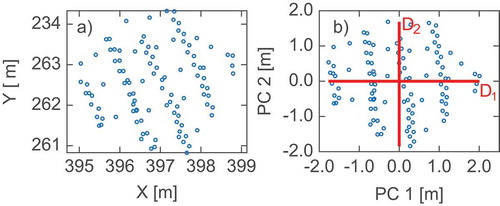
Figure 7. The impact of the α value on crown shape delineation.
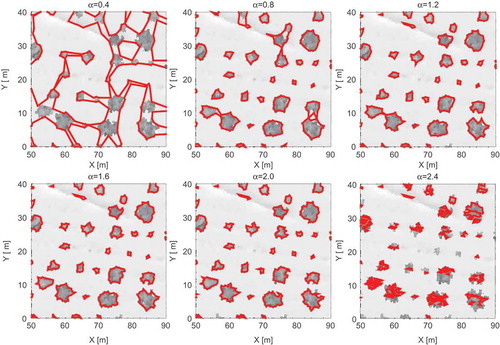
Figure 8. (a) Relation between the α parameter value and the number of detected trees and (b) correlation coefficients between estimated parameters and field measurements.
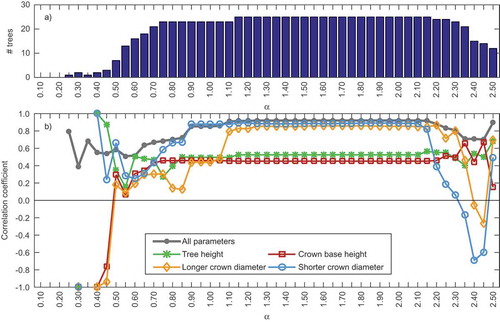
Figure 9. α value adjustment results depending on the number of trees used for adjustment.
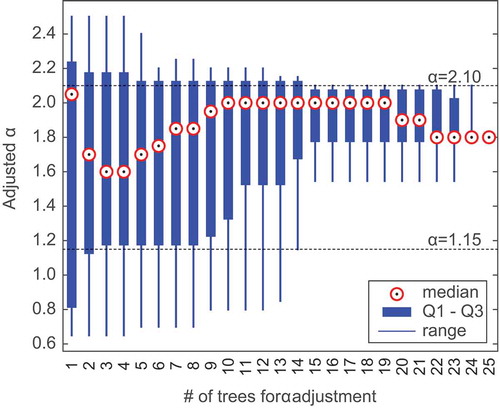
Figure 10. Part of the study area: (a) crown contours obtained with α = 1.80 over near-infrared spectrum orthophotomap, (b) and (c) normalized ALS point cloud along two 5 m wide traverses.
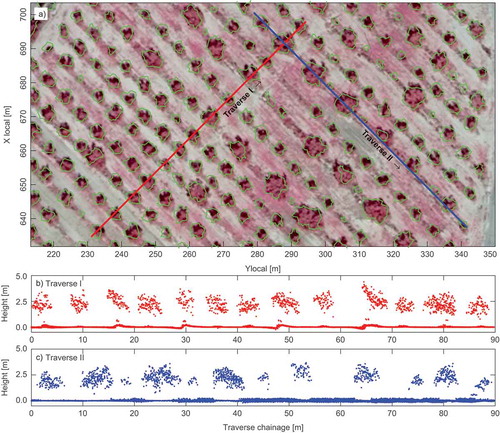
Figure 11. Estimated and measured values of tree height, crown base height, crown diameters, and crown area for sampled trees.
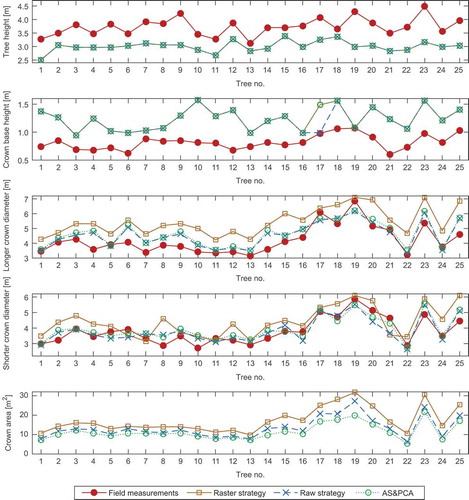
Figure 12. (a) Correlation coefficient and (b) RMSE for each strategy and each estimated parameter.
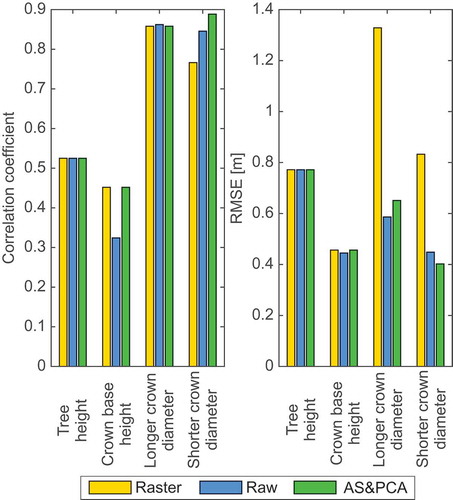
Table 3. RMSE values of estimated parameters.
Table 4. The p-value of Mann–Whitney U test for the similarity of diameters between strategies.