Figures & data
Figure 1. Study area and area selected for classification test. Background is a Quickbird image acquired on 14 July 2013 in true color composition.
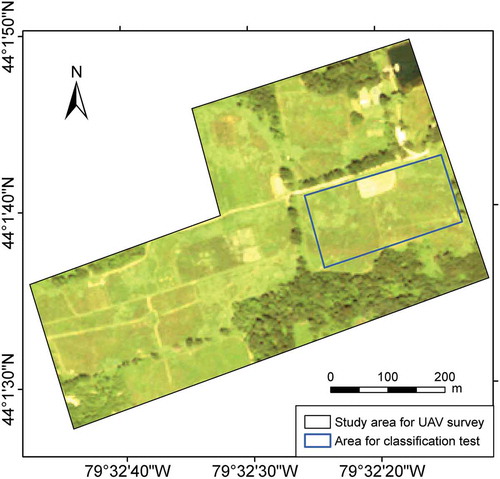
Figure 2. UAV system, camera, and a sample photo. Sample photo is NIR–green–blue color composition; vegetation show red color.
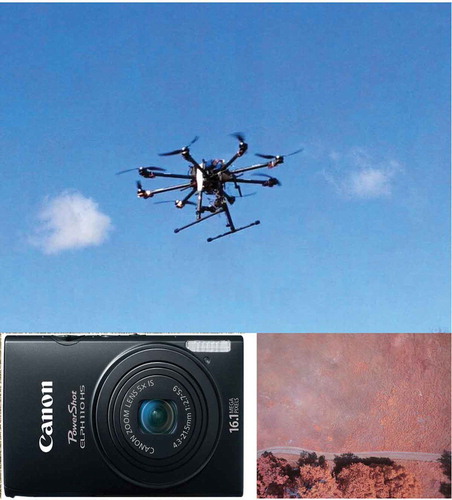
Figure 3. Photos showing a more homogeneous (left, photo taken on 11 June 2015) and a more heterogeneous (right, photo taken on 9 July 2015) species composition.
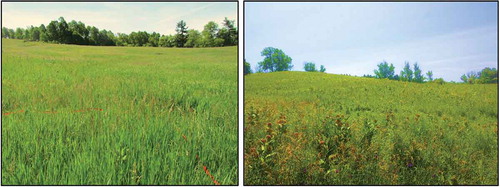
Figure 4. Workflow of imagery processing and multi-scale species classification.
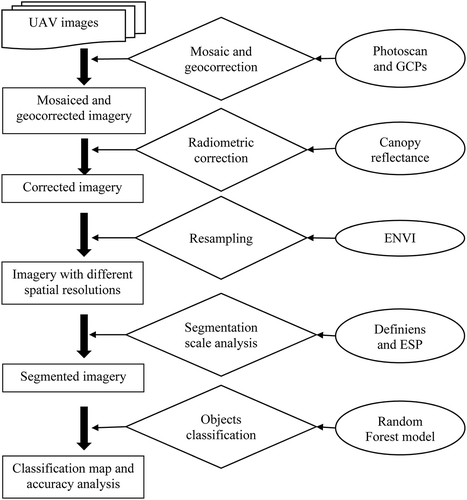
Figure 5. Estimation of scale parameters for multiresolution segmentation of 5 cm image using ESP. The abrupt increases of rate of change (dark grey color curve) indicate the optimal scales for segmentation.
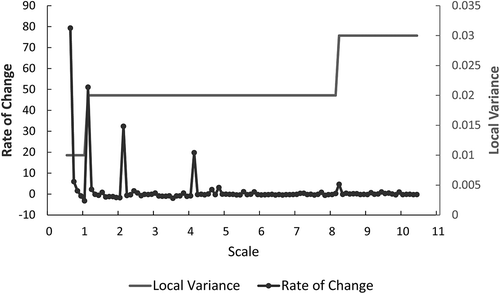
Figure 6. Classification tree built for imagery acquired on 11 June 2015 with spatial resolution of 10 cm. Classes in the grey colored boxes represent classified species. Bold letters show selected features as classifiers; specific threshold values for different features were not shown for the sake of comprehension.
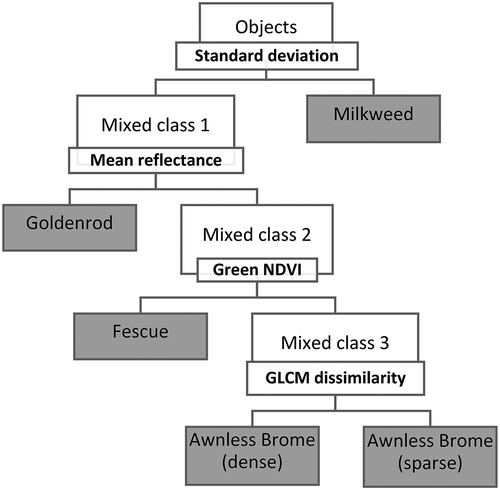
Table 1. Error matrix of classification model for imagery with different spatial resolutions.
Figure 7. Comparison of object features (i.e., green NDVI and Standard deviation) for imagery acquired on 11 June 2015 with different spatial resolutions.
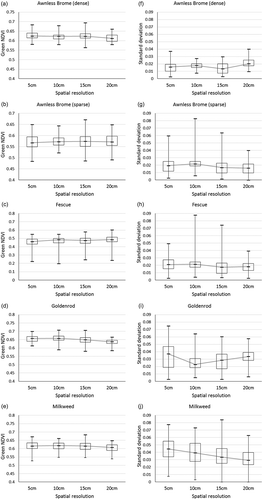
Figure 8. Comparison of producer’s and user’s accuracy of classification using imagery acquired on 11 June 2015 with different spatial resolutions, respectively.
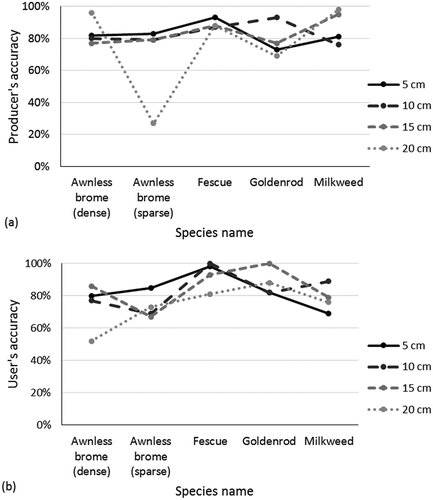
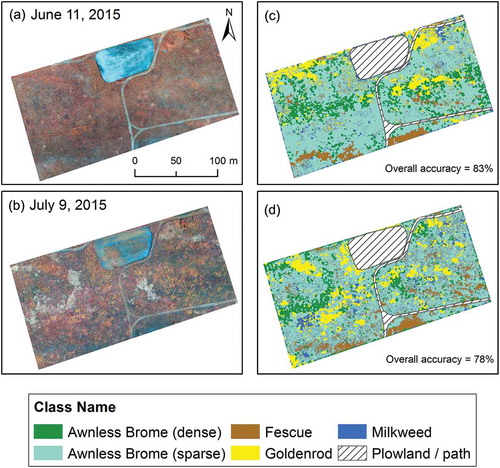
Figure 9. Original images (left, NIR–green–blue color composition) and corresponding classification maps (right). Images were acquired on 11 June and 9 July 2015 and with spatial resolution of 10 cm.