Figures & data
Figure 1. Cropland distribution in the Fergana Valley. Rivers, intake points, and irrigation canals are shown in shades of blue. The settlements, in yellow, were derived by means of on-screen digitization of GoogleEarth™ images from 2016. Crop yield and acreage statistics were available for the districts in the eastern and south eastern parts solely (grey polygons).
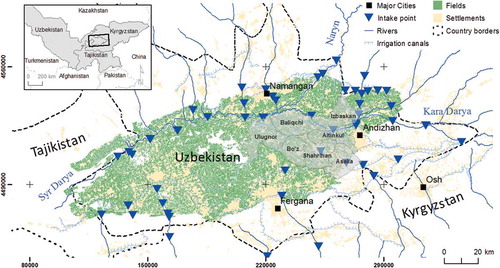
Table 1. Number of reference fields per year and per crop. In total, there were 3,211 fieldswith known crop type.
Figure 2. Workflow of the method and its associated maps: crop type, crop yield, water-use efficiency, agricultural indicators, and identification of homogeneous areas.
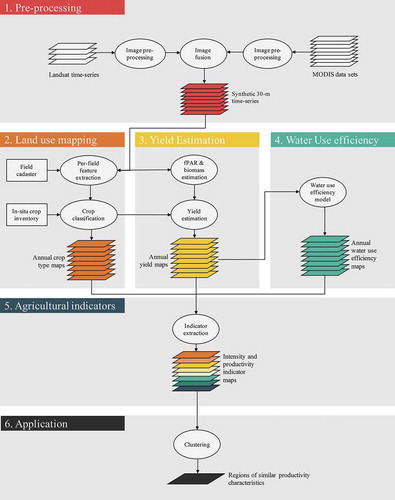
Figure 3. Example of data fusion of NDVI could free maps in 2004. Left: original Landsat-7 image with SLC-off, middle: MODIS image, right: cloud- and gap-free synthetic image.
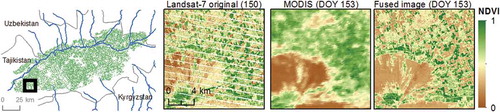
Figure 4. Generalized scheme of NDVI phenological metrics for the growing season. The phenological metrics are in fact statistical descriptors of the NDVI trajectory of a field.
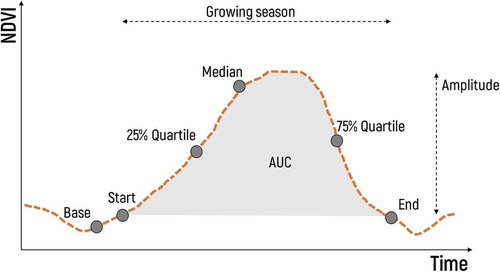
Table 2. Multi-year cropland use intensity indicators, their purpose, and selected references.
Table 3. Overall and per-class classification accuracies (F-score) of land cover maps. Pooled refers to the classification based on training data from four years pooled together. Accuracies of individual years with test data are given separately.
Figure 5. (a) Estimated crop area through the LUE-model by district and year against reported crop yields for 2010–2012. (b) Same as (a) but for crop yield.
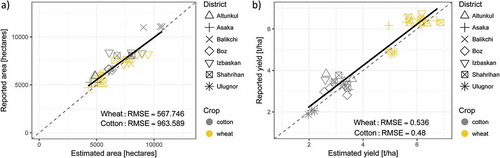
Figure 6. Maps for assessing cropland use intensity and productivity pattern (based on yield and water-use efficiency) at the field level.
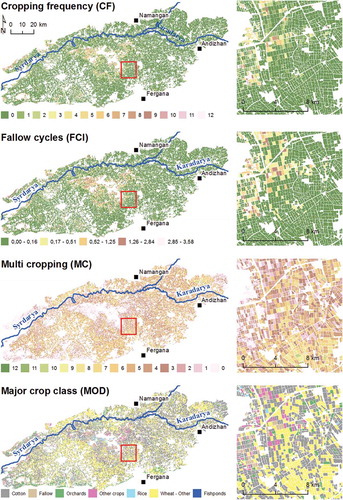
Figure 6. (Continued).
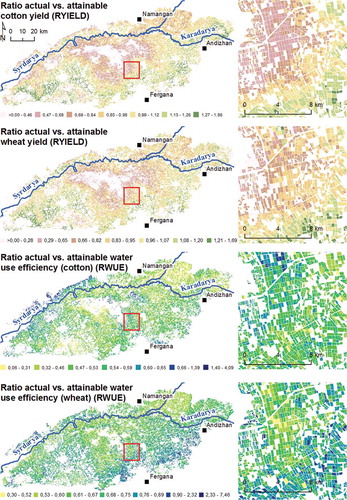
Table 4. Crop class statistics in Fergana Valley. Cultivated area per crop class are given in square kilometres. Statistics were derived from annual crop maps.
Figure 7. Homogeneous regions (clusters) with similar cropping intensity and productivity properties, based on the portioning-around-medoids clustering. Clustering was not performed for those fields never planted with cotton or winter wheat.
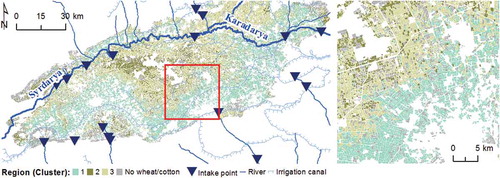
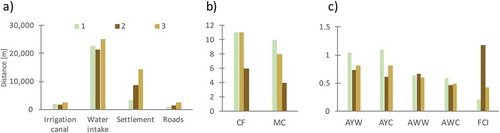
Figure 8. For three regions (clusters, see ), (a) distances to irrigation canals, intake points, settlements, and roads; (b) CF = cropping frequency, MC = multi cropping; (c) median values for AYW/AYC = average attainable yield for wheat/cotton, AWW/AWC = average water-use efficiency for wheat/cotton (), FCI = fallow cycles. Colours of the bars correspond to clusters in .