Figures & data
Figure 1. Location of the study areas in Chicago (America), Venice (Italy), and Guangzhou (China) with training and validation area.
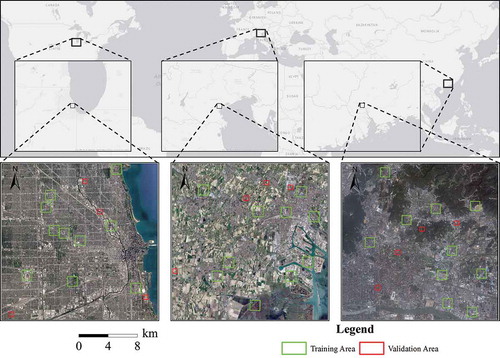
Figure 2. Process of ISA estimation with CART: (a) one of the training areas in QuickBird imagery (Guangzhou); (b) binary map of impervious surfaces in training area extracted using O-O classifier; (c) grid corresponding to Landsat8 Oli imagery in training areas; (d) density of impervious surfaces in training area (30 m resolution) for training; (e) one of the validation areas in QuickBird imagery (Chicago); (f) density of impervious surfaces in validation area (30 m resolution) for accuracy validation.
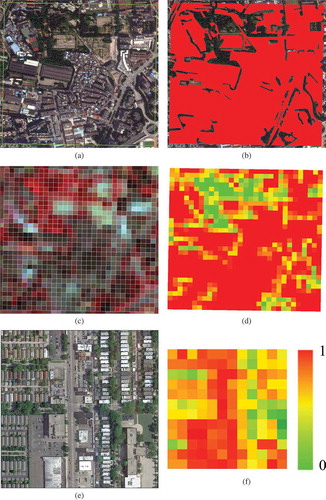
Figure 3. Procedure of improved CART algorithm by LSMA and error analysis.
Figure 4. Impervious surfaces estimated by CART and LSMA.
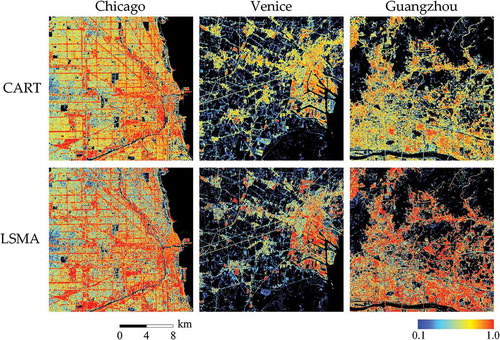
Figure 5. Accuracy assessment scatter plot of (a) CART and (b) LSMA.
Figure 6. (a) Box plot of REc, (b) quantity of pixels aggregated by ABS of REc, and (c) ISAc.
Figure 7. MAE of CART and LSMA estimation in different ISA.
Figure 8. Improved estimation of impervious surfaces in (a) Chicago, (b) Venice, (c) Guangzhou, and (d) accuracy assessment.
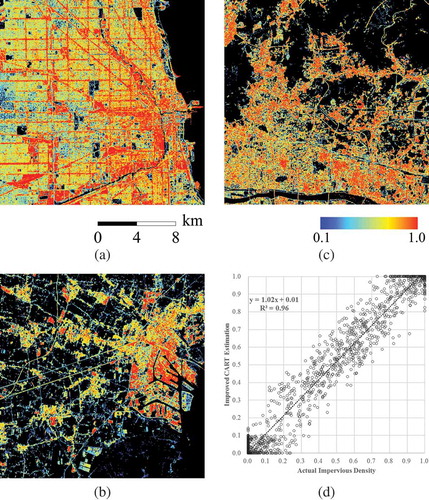
Table 1. Accuracy of impervious estimation.
Table 2. Accuracy assessment comparison of different methods tested in study area of Chicago.
Table 3. Accuracy assessment comparison of different methods in related research.
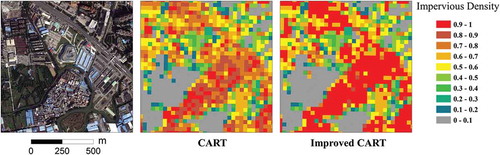
Figure 9. Small-scale comparison of the estimation results of conventional and improved CART in Guangzhou, China.