Figures & data
Figure 1. The three study sites in Queensland: (a) Gordonvale; (b) Home Hill; (c) Mackay, and (d) study site locations in Queensland. The black outlines on the GeoEye-1 images in (a)-(c) indicate the areas captured by the GeoEye-1 satellite sensor.
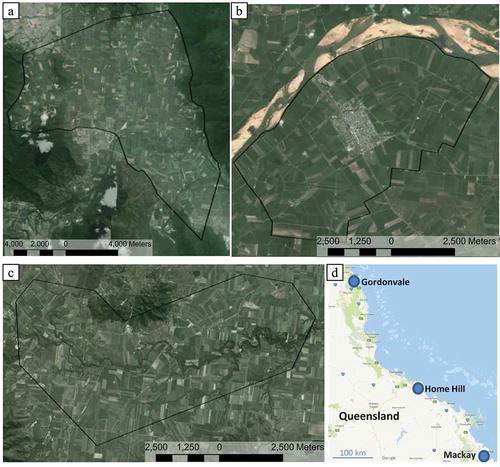
Figure 2. (a) Canegrub infested sugarcane showing tool tipping, changed leaf color, and exposure of soil; (b) greyback canegrubs; (c) roots damaged by canegrubs; and (d) aerial photo from helicopter, showing advanced canegrub damage.
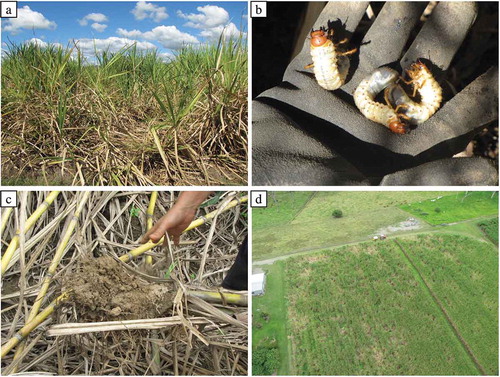
Table 1. GeoEye-1 image collection dates for the three study sites.
Figure 3. (a) Image subset in the Gordonvale area with known canegrub damage; (b) block-boundary segmentation (yellow lines); (c) classification of fallow and sugarcane fields; (d) fine-scale segmentation (blue lines); (e) normalized difference vegetation index; (f) texture image; (g) classification of potential canegrub damage objects; and (h) classification of high, medium, and low likelihood of canegrub damage.
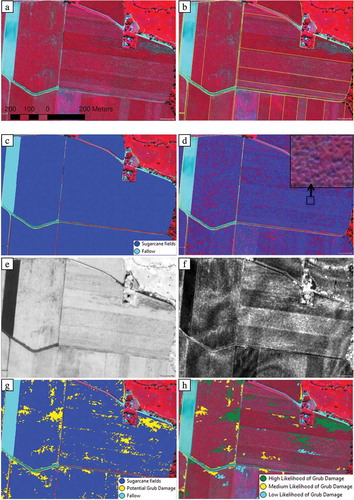
Figure 4. Categorising potential canegrub damage into low, medium, and high likelihood of canegrub damage.
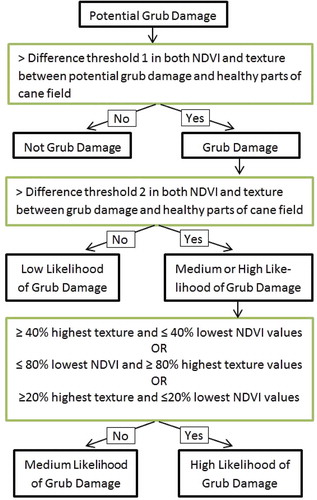
Figure 5. (a) Original pan-sharpened GeoEye-1 image and (b) the corresponding map of canegrub damage.
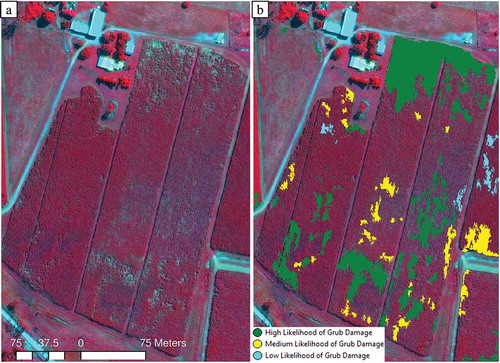
Table 2. Measure of producer’s accuracy and error of omission for mapping low/medium/high likelihood of canegrub damage, respectively, in 2012, 2013, and 2014 for the Mackay site.
Table 3. Measure of producer’s accuracy and error of omission for mapping low/medium/high likelihood of canegrub damage, respectively, canegrub damage in 2012, 2013, and 2014 for the Gordonvale site.
Table 4. Measure of producer’s accuracy and error of omission for mapping low/medium/high likelihood of canegrub damage, respectively, in 2012, 2013, and 2014 for the Home Hill site.
Table 5. Minimum, maximum, first quantile (Q1), median, and third quantile (Q3) values of the number of canegrubs found from digging up 20 stools within 20 m × 13 row areas at the Mackay site in 2012, 2013, and 2014 compared against the mapped likelihood of canegrub damage. The n = total number of samples per category. For the one sample classified as Low likelihood, no canegrubs were found.
Table 6. Area and proportion of blocks mapped with different areal extents of canegrub damage in 2012, 2013, and 2014 for the Mackay study site.
Table 7. Area and proportion of blocks mapped with different areal extents of canegrub damage in 2012, 2013, and 2014 for the Home Hill study site.
Table 8. Area and proportion of blocks mapped with different areal extents of canegrub damage in 2012, 2013, and 2014 for the Gordonvale study site.
Figure 6. Risk map showing different extent of canegrub damage within each individual block.
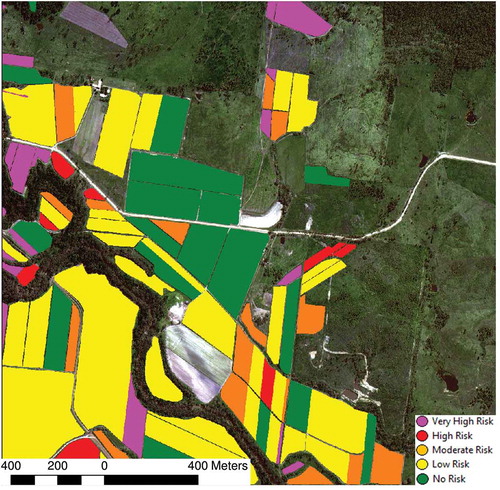
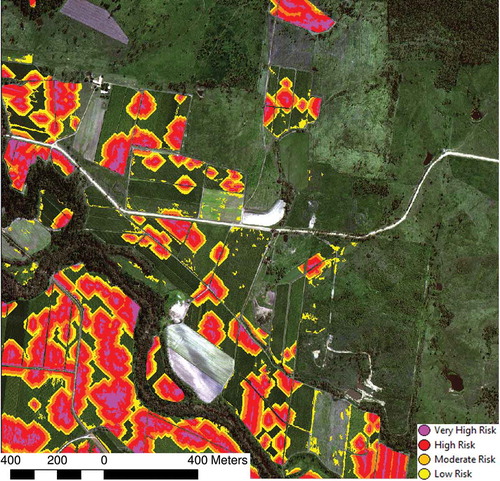
Figure 7. Risk map showing different levels of risk based on distance to mapped canegrub damage.