
Figures & data
Figure 1. Study area: left corner highlight the area seriously impacted by invasive vegetation Cogon Grass.
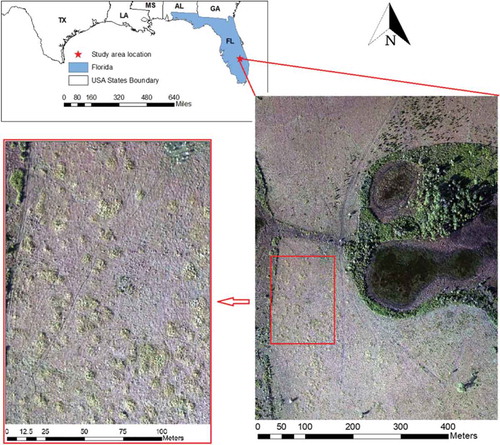
Table 1. Land cover classes in the study area.
Table 2. Summary of sensor and flight procedure.
Figure 2. Two options for generating training samples: (a) option I labels the surrounding pixels as background regardless of their actual class types and (b) option II labels all the pixels with their true labels.
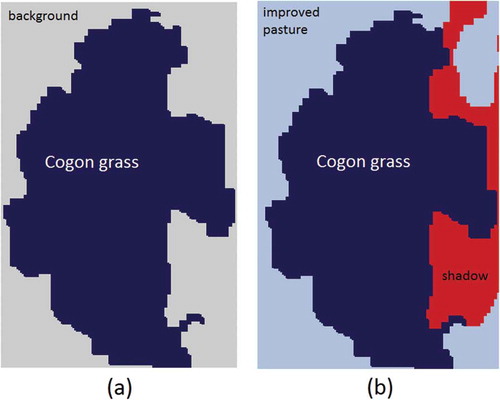
Figure 3. Flow chart of conducted experiments.
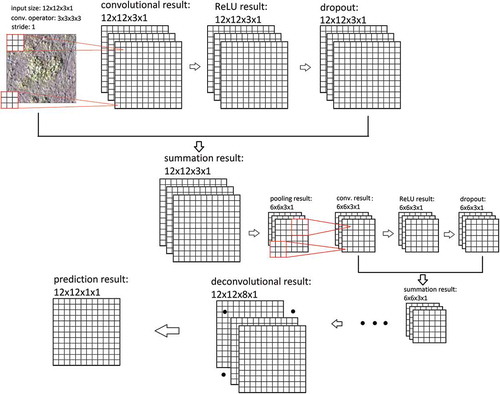
Figure 4. Flow chart of conducted experiments.
Figure 5. Overall accuracies obtained from five classification methods with three sets of training samples.
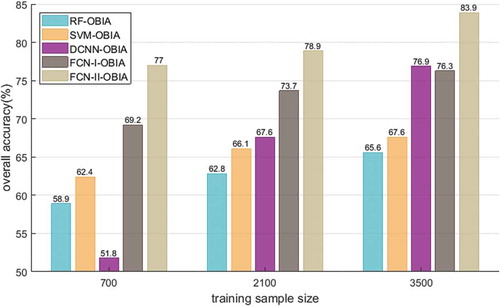
Figure 6. Producer and user accuracies for different classification methods with different sets of training samples.
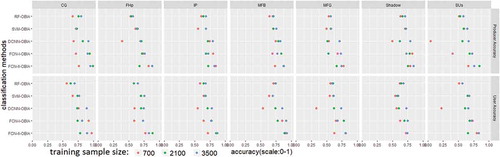
Figure 7. Maps generated by five classification methods using 3500 training samples.
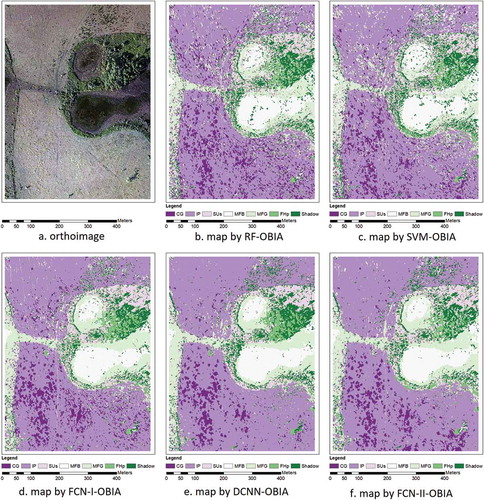
Figure 8. Zoom-in version of maps focusing on Cogon grass area.
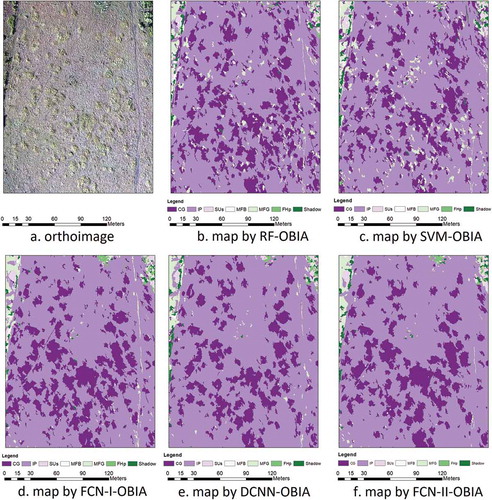
Table 3. Confusion matrix for FCN-II-OBIA classification results.