Figures & data
Figure 1. The architecture of the FAM.
Figure 2. Object-based entropy query-by fuzzy ARTMAP joint classification change detection diagram.
Figure 3. Study area in Liaohe estuarine wetland.
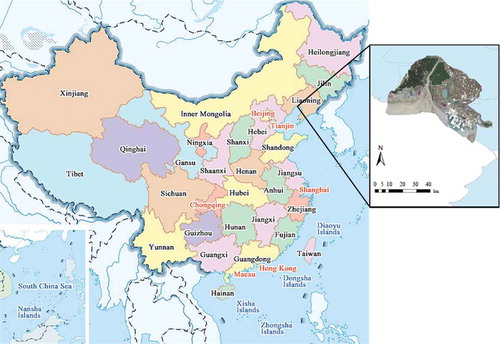
Table 1. Detailed information of remote sensing images used in the experiments.
Figure 4. True color remote sensing images of the study area captured in 1987, 1989, 1995, 2000, 2004, 2009, 2013, and 2014.
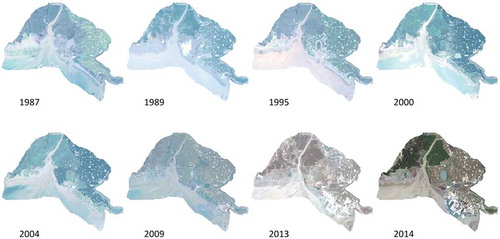
Figure 5. Comparison of classification accuracy in 1989 remote sensing images with different number of initial training samples, (a) the initial number of training samples is 60, (b) the initial number of training samples is 70, (c) the initial number of training samples is 80, (d) the initial number of training samples is 90.
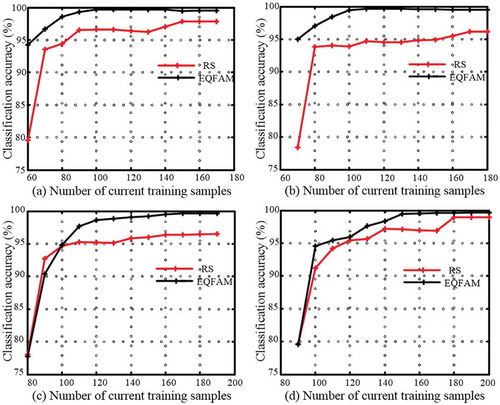
Figure 6. The process of pixel-based and object-based joint classification comparison in the sub-study area.
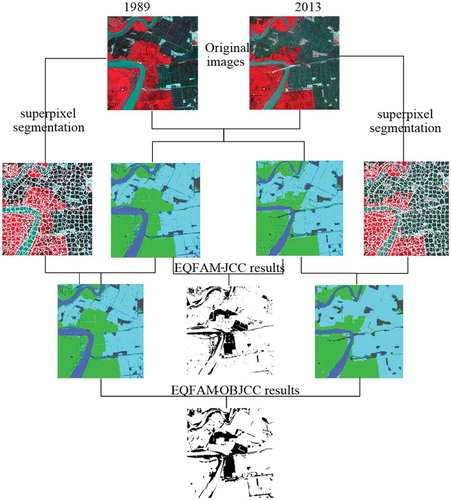
Table 2. The parameters of the FAM neural network.
Figure 7. Comparison of classification result for different methods between 1989 and 2013 remote sensing images. (a) The original false color images, (b) FAM-PCC with average accuracy of 86.93%, (c) K-means-JCC with average accuracy of 88.89%, (d) FAM-JCC with average accuracy of 90.52%, (e) EQFAM-JCC with average accuracy of 91.98%, (f) EQFAM-OBJCC with average accuracy of 94.12%.
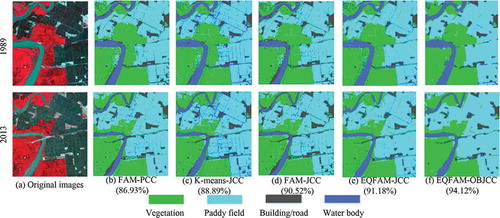
Figure 8. Comparison of change detection results for different methods between 1989 and 2013 remote sensing images. (a) FAM-PCC with total error of 39.38%, (b) K-means-JCC with total error of 37.78%, (c) FAM-JCC with total error of 32.04%, (d) EQAM-JCC with total error of 30.94%, “(e) EQFAM-JCC (f) EQFAM-OBJCC with total error of 27.03%.
Table 3. Comparison of change detection results of five different methods.
Figure 9. Land use/cover classification results of Liaohe estuarine wetland in 1987, 1989, 1995, 2000, 2004, 2009, 2013, and 2014.
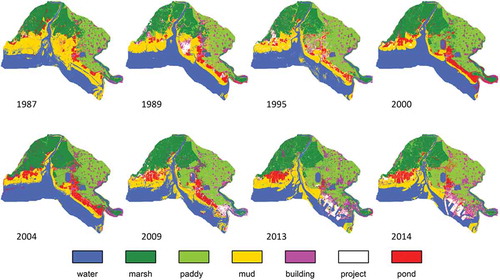
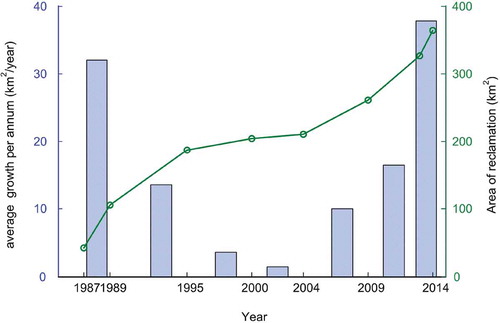
Table 4. Statistical area of reclamation activity (km2) 1987–2014.
Figure 10. Reclamation monitoring results during 1987–1989, 1989–1995, 1995–2000, 2000–2004, 2004–2009, 2009–2013, 2013–2014, and 1987–2014.
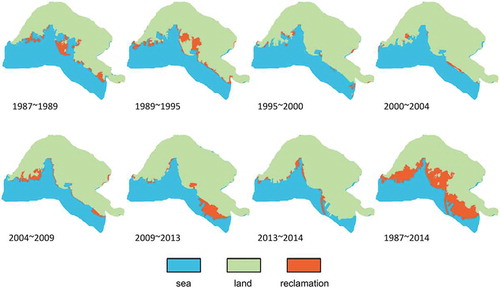
Figure 11. Area change of reclamation from 1987 to 2014 (km2).