Figures & data
Figure 1. Study area: Altamira TransAmazon Highway region, Pará State, Brazil, and Xingu River, highlighting Belo Monte Dam.
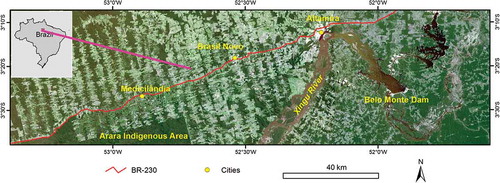
Table 1. Datasets used in research.
Figure 2. The modified strategy for mapping land-cover distribution from Landsat imagery using the hierarchical-based approach (Note: TM, Thematic Mapper; NDVI, normalized difference vegetation index; MNDWI, modification of normalized difference water index; SF, secondary forest; AP, agropasture).
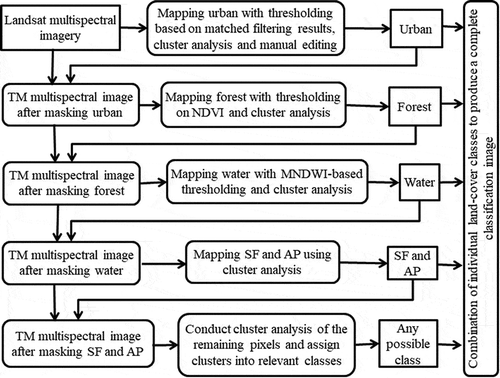
Table 2. Accuracy assessment result of the 2014 land-cover classification imagery.
Figure 3. Land-cover distributions at different years between 1991 and 2017.
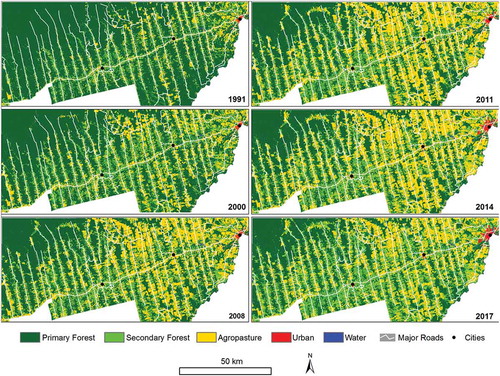
Figure 4. Proportion of land-cover types over time: a comparison of land-cover trends between 1991 and 2017 at nine-year intervals (solid lines) and between 2008 and 2017 at three-year intervals (dashed lines) (Note: PF, primary forest; SF, secondary forest; AP, agropasture; UR, urban; WA, water; percent of a land cover type = (Ai/A)*100, where Ai is the total area of the ith land-cover type and A is the total study area).
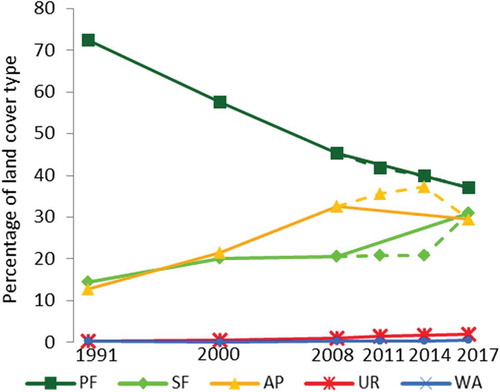
Table 3. Summary of unchanged land-cover types between 1991 and 2017 and the land-cover types that changed at least once based on the 1991 land-cover data.
Figure 5. Annual land-cover change (ha/yr) at different change detection periods (nine-year and three-year intervals) (Note: PF, primary forest; SF, secondary forest; AP, agropasture; UR, urban; WA, water; Annual land-cover change (ha/yr) = [Ai(t2) – Ai(t1)]/(t2-t1), where Ai is the total area of the ith land cover type, A is the total area, and t1 and t2 are prior and posterior years).
![Figure 5. Annual land-cover change (ha/yr) at different change detection periods (nine-year and three-year intervals) (Note: PF, primary forest; SF, secondary forest; AP, agropasture; UR, urban; WA, water; Annual land-cover change (ha/yr) = [Ai(t2) – Ai(t1)]/(t2-t1), where Ai is the total area of the ith land cover type, A is the total area, and t1 and t2 are prior and posterior years).](/cms/asset/e9778dba-c9c7-4155-bba2-725ce2fa9339/tgrs_a_1497438_f0005_oc.jpg)
Figure 6. Land-cover change trajectories at different detection periods (nine-year and three-year intervals) (Note: PF, primary forest; SF, secondary forest; AP, agropasture; UR, urban city; WA, water).
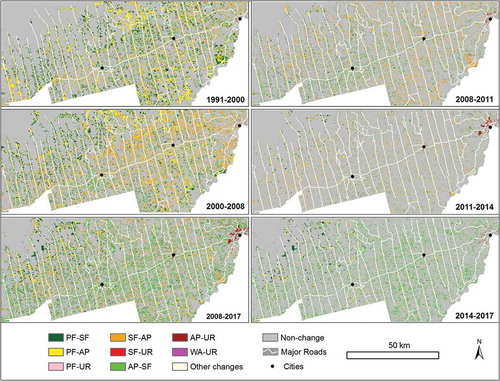
Figure 7. Comparison of land-cover changes at different detection periods (a: primary forest loss; b: urban gain; c: secondary forest loss and gain; d: agropasture loss and gain) (Note: PF, primary forest; SF, secondary forest; AP, agropasture; UR, urban; WA, water).
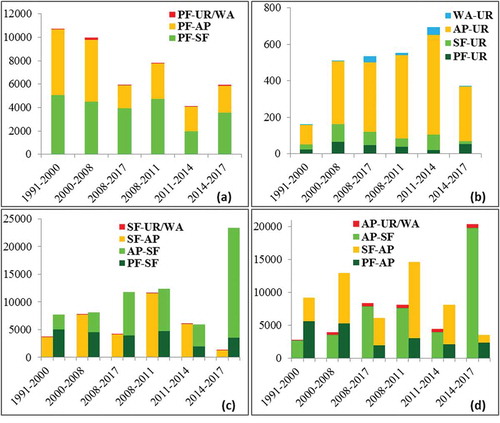
Figure 8. Individual land-cover changes over time (a: nine-year detection interval; b: three-year detection interval) (Note: PF, primary forest; SF, secondary forest; AP, agropasture; UR, urban; WA, water).
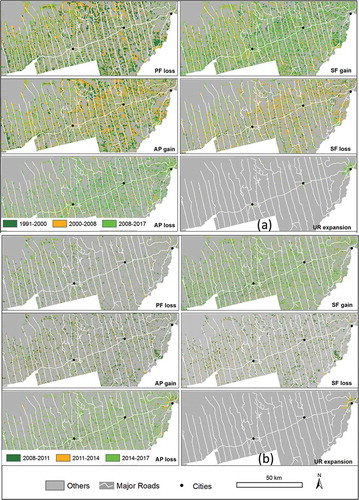
Table 4. Land-cover change trajectories over the study region at different detection periods.
Figure 9. Intermediate land-cover dynamic changes detected within three-year intervals between 2008 and 2017 (Note: PF, primary forest; SF, secondary forest; AP, agropasture).
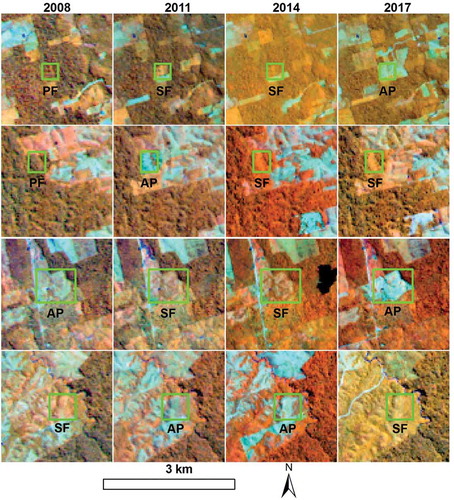
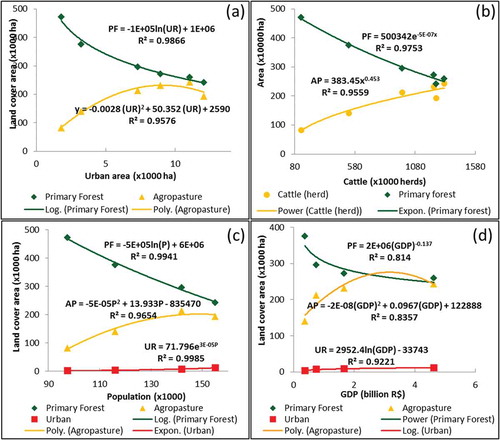
Figure 10. Impacts of population, economic growth, and cattle on major land-cover changes (a: impacts of urbanization on deforestation and agropasture expansion; b: impact of cattle herds on agropasture area; c: impacts of population on deforestation and agropasture expansion; d: impacts of gross domestic product on deforestation and agropasture expansion) (Note: PF, primary forest; AP, agropasture; UR, urban; GDP, gross domestic product).