Figures & data
Figure 1. SBR approximation of objects (Du, Shu, and Feng Citation2016a).
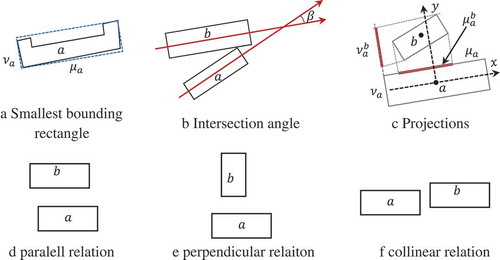
Figure 2. Fitting degree of SBR.
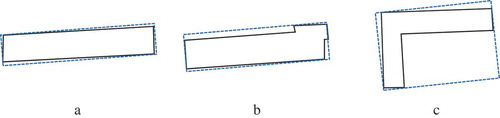
Figure 3. Fitting degree of SBR, where the black line is the skeleton of the polygon.
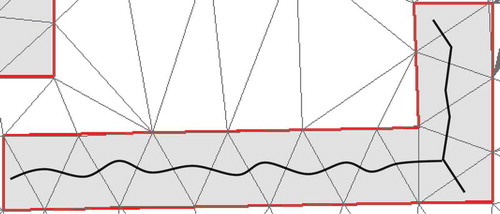
Figure 4. Delaunay triangulation of buildings, where the red polygons enclose the between/among regions and the yellow polygons refers to the types of triangles (modified from Du et al. Citation2016b).
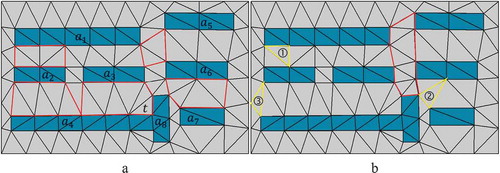
Figure 5. Spatial regions of azimuth relations.
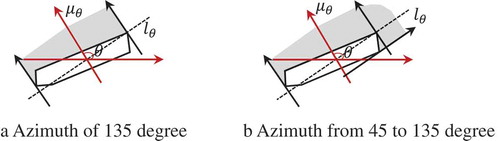
Figure 6. Spatial regions of alongness relations.
Figure 7. The among regions, while the red triagnles refer to the first one to be added into the among region.
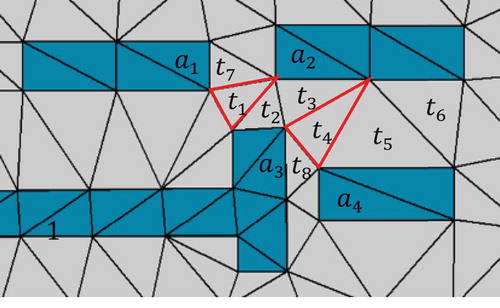
Figure 8. The surrounding regions, where the yellow polygons refer to the surrounding regions, while the red polygon refers to the among region.
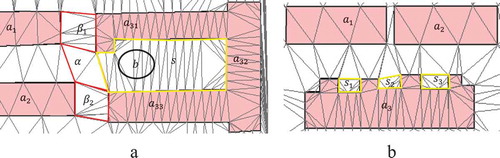
Figure 9. Combination of alongness and azimuth relations.
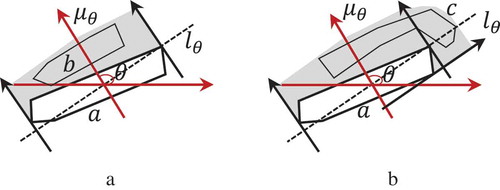
Figure 10. Test data. (a) Quickbird image in Beijing city and (b) existing vector buildings and roads.
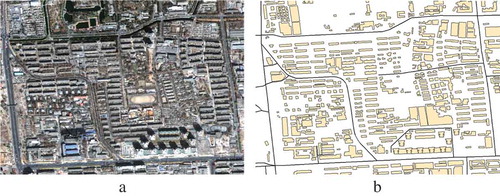
Table 1. The number of training and test samples for each class.
Figure 11. The training samples in the initial classification.
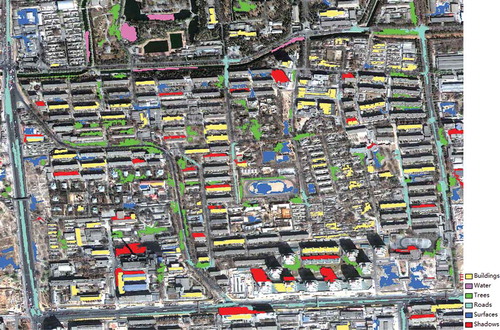
Figure 12. Results of extracted relational contexts. (a) Collinear building patterns, (b) the betweeness relations among all buildings, (c) betweeness regions between buildings within building patterns, and (d) betweeness regions among collinear building patterns.
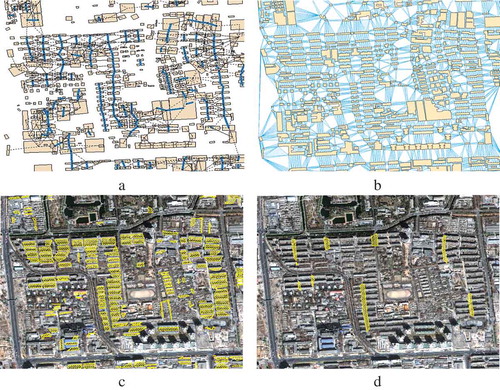
Figure 13. Results of initial classification. (a) Segmented objects, and (b) classified objects.
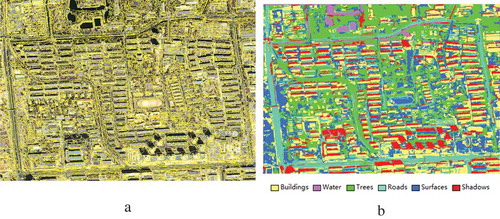
Table 2. The features used in the initial classification.
Table 3. Confusion matrix of the initial classification results.
Figure 14. Examples of misclassified classes. (a) Buildings classified as roads, (b) buildings as surfaces, (c) water as shadows, (d) trees as surfaces, (e) trees as roads, (f) roads as buildings, (g) roads as surfaces, (h) surfaces as buildings, (i) surfaces as roads, (j) shadows as trees, (k) shadows as roads, and (l) shadows as water.
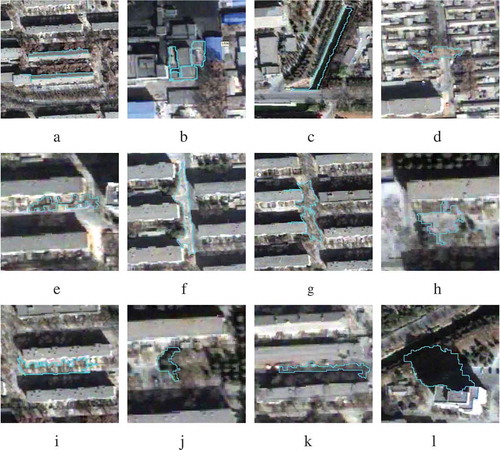
Figure 15. Retrieved image objects using relational contexts. (a) Overlay of the initial classification and the relational contexts, and (b) the objects located in the relational contexts.
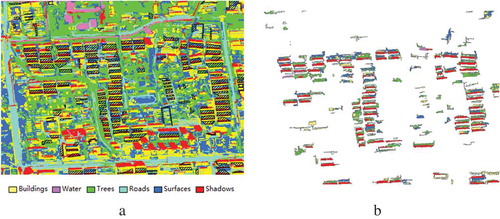
Figure 16. Azimuth and alongness relations for distinguishing water and shadows.
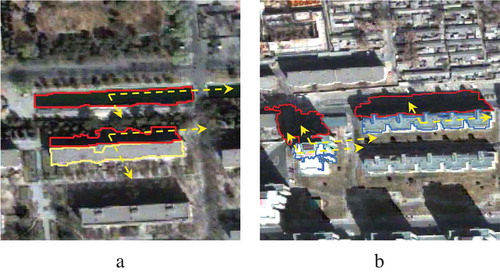
Figure 17. The refined results of post-processing.
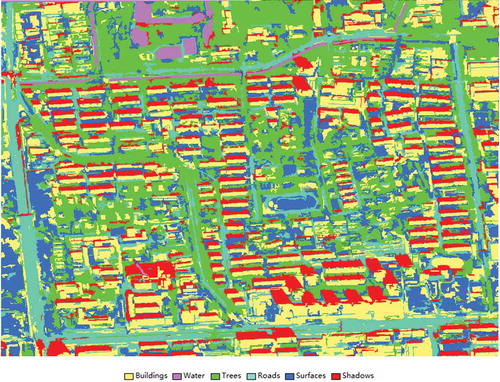
Table 4. Confusion matrix of refined classification.
Figure 18. A map of differences between (a) the initial results and (b) the refined results.
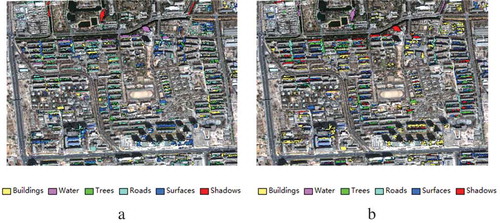
Figure 19. The test on GF-2 data. (a) The experimental image, (b) betweeness regions between buildings within building patterns, (c) the reclassified objects in the post-classification, and (d) the same objects in (c) in the initial classification.
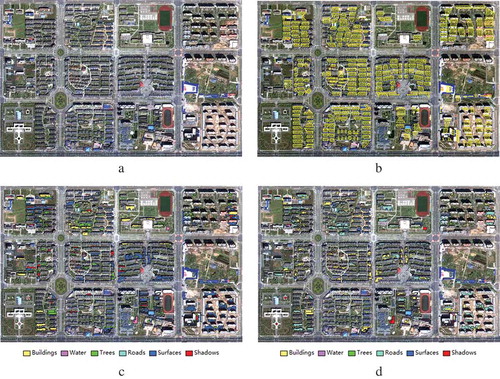
Table 5. Confusion matrix of initial classification results using GF-2 data.
Table 6. Confusion matrix of refined classification results by relational contexts.
Table 7. Confusion matrix of refined classification results by the CRF model.
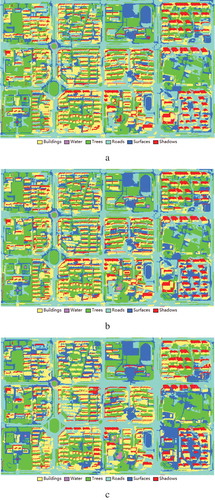
Figure 20. The classification results. (a) The initial results, (b) the results refined with relational contexts, and (c) the CRF-refined classification results.