Figures & data
Figure 1. Map of the study area: Lower Chippewa River watershed (a), Wisconsin (b), USA (c).
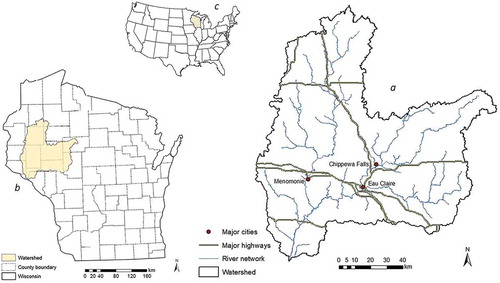
Table 1. Land change drivers & constraints.
Table 2. LULC trajectory used in creating probability/transition potential Surfaces.
Figure 2. Projected land use data model construction.
Note: Dse socioeconomic drivers, Dpr proximity drivers, Dpb probability driver, 1–3 perceptron, w weights, Ci first constraint (e.g. forest), Cn last constraint (e.g. urban growth boundary).
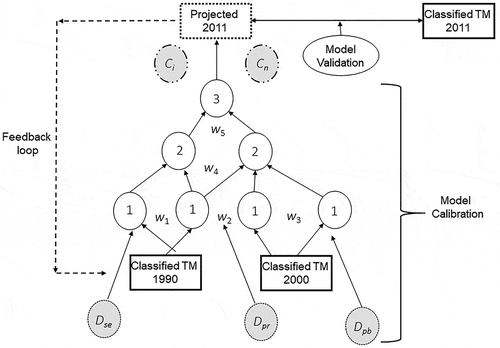
Figure 3. Comparison of overall accuracy for historical and contemporary images.
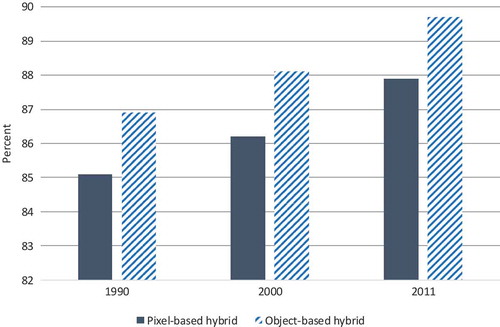
Table 3. Producers and users accuracy for pixel-based hybrid classified images.
Table 4. Producers and users accuracy for object-based hybrid classified images.
Table 5. Land use/land cover net gain transition matrix (hectares).
Figure 4. Historical and contemporary object-based hybrid classified images for 1990 (a), 2000 (b), and 2011 (c).
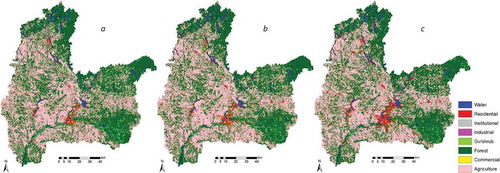
Figure 5. Percentage change in LULC, 1990–2011.
Note: GV green vegetation.
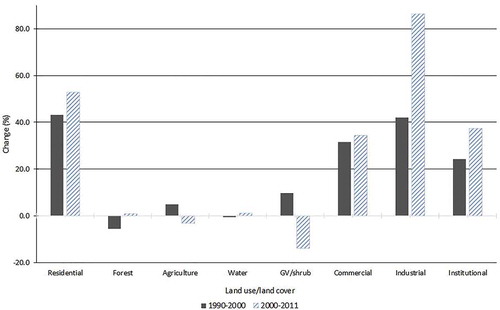
Figure 6. Snippet of 2011 pixel-based hybrid projected image (a) compared to object-based hybrid (b).
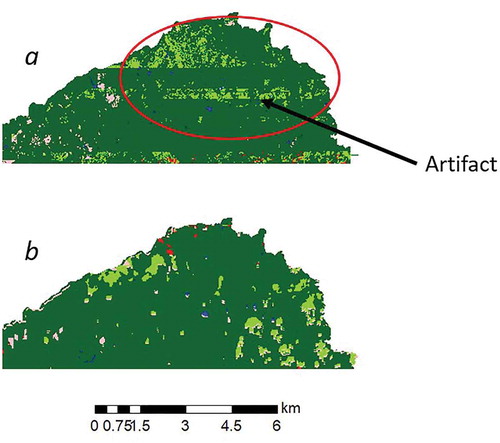
Figure 7. Average ROC performance of model for all projected 2011 LULC classes.
Note: AUCO is object-based hybrid, AUCP is pixel-based hybrid.
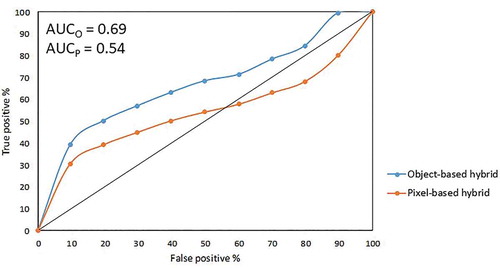
Figure 8. ROC performance of models per projected 2011 LULC class.
Note: AUCO is object-based hybrid ![]()
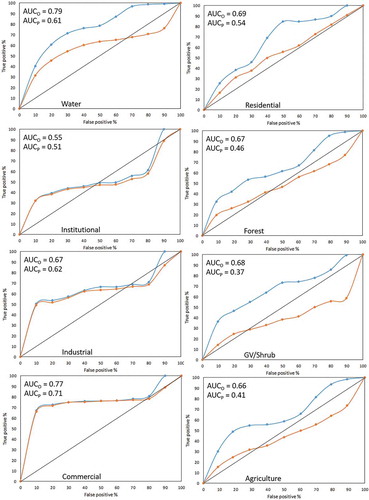
Figure 9. Contemporary and projected images for 2011 (a), 2030 (b), and 2050 (c).
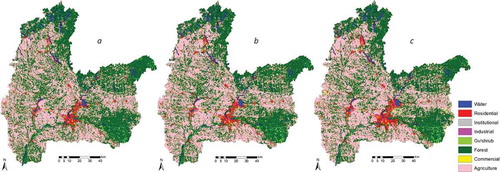
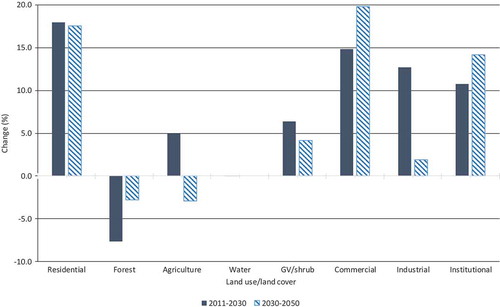
Figure 10. Potential percentage change in LULC, 2011–2050.
Note: GV green vegetation.