
Figures & data
Figure 1. Study area. teacapan-agua brava lagoon system, northwest mexico. the left map shows the main lagoons and estuaries and the mangrove surface used as baseline for the seasonal trend analysis (sta). in the right map, tidal basin limits based on Blanco et al. (Citation2011).
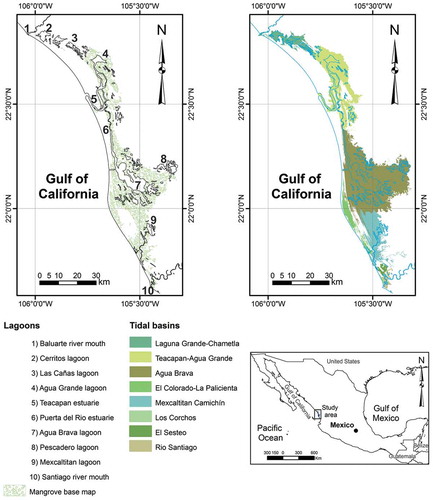
Table 1. Mangrove distribution by tidal basin in the Teacapan-Agua Brava lagoon system, Mexico. Basin area estimates are based on Blanco et al. (Citation2011) and mangrove area from a mangrove distribution map by Berlanga-Robles and Ruiz-Luna (Citation2007).
Table 2. Kendall correlation between the observed NDVI and EVI monthly profiles and the observed profiles of six climatic variables: IV) vegetation index; Tmax) maximum temperature; Tmin) minimum temperature; Ptmon) monthly precipitation; Pacu) accumulated precipitation: Rh) relative humidity; Sr) solar radiation. The correlations were based on 163 months, from January 2001 to July 2014. The bold values are the significant correlations for α = 0.05 and n = 163. In parentheses the p-values.
Figure 2. Vegetation indices and climatic variables profiles: a) NDVI, b) EVI, c) maximum temperature, d) minimum temperature, e) monthly precipitation, f) accumulated precipitation, g) relative humidity and h) solar radiation. solid lines show the observed profiles. dashed lines show the monotonic trend or the fitted seasonal curves.
Figure 3. False color composition images of the slopes of the shape parameters of the NDVI and EVI time series. the images a and b were edited filtering the amplitude 0 slopes in red, the amplitude 1 slopes in green and the amplitude 2 slopes in blue. the images c and d filtered the amplitude 0 slopes in red, the phase 1 slopes in green and the phase 2 slopes in blue. the graphs present the fitted seasonal curves for the beginning (solid) and the end (dashed) of the series for different pixel samples in the study area.
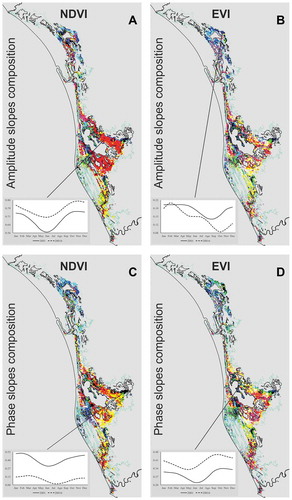
Figure 4. Fitted seasonal curves at the beginning (2001) and the end (2016) of the NDVI (left) and EVI (right) times series for tidal basins in the Teacapan-Agua Brava lagoon system: T-AG. Teacapan-Agua Grande; AB. Agua Brava; C-P. El Colorado – La Palicienta; M-C. Mexcaltitan-Camichin; S. El Sesteo; RS. Rio Santiago.
Table 3. Pearson correlation between the NDVI and EVI seasonal fitted curves for the beginning (2011) and end (2016) of the time series with the seasonal fitted curves of six climatic variables. The bold values are the significant correlations for α = 0.05 and n = 12. In parentheses the p-values.
Table 4. Mangrove canopy trends and mangrove change. The canopy classes were defined according to the significance (α = 0.05) of Amplitude 0 Z-value images for NDVI (a) and EVI (b). The mangrove change classes (c) were derived from a post-classification comparison of mangrove distribution maps from 2005 and 2015 produced by CONABIO.
Figure 5. z value images and mangrove canopy condition maps generated from the Mann-Kendal significance test for the Amplitude 0 slopes of the NDVI (A and B) and EVI (C and D) time series. The graphs are the NDVI (solid) and EVI (dashed) estimated annual profiles for the tidal basins of the Teacapan-Agua Brava lagoon system. The lines represent the monotonic trend. The t and Qi values are the estimated Mann-Kendal Tau and the Sen slopes (vegetation index/year), respectively.
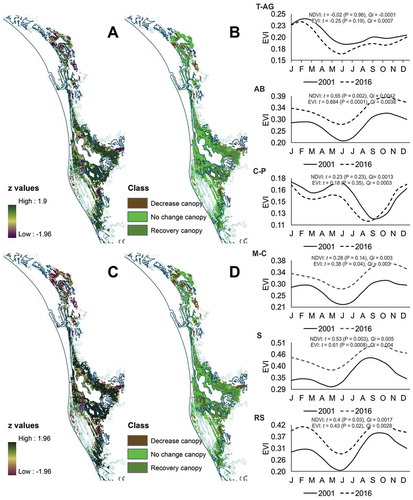
Table 5. Proportional error matrices, based on the 26,097 pixels (163,106.25 ha), comparing of the NDVI and EVI mangrove canopy trends maps (a) and these maps again to a 2005–2015 mangrove change map (b and c).