
Figures & data
Figure 1. Location of Hungary and the analyzed data points by macro-regions and land cover types; AF – artificial surfaces; AL – arable land; F – forest; GL – grassland; W – water; WL – wetland.
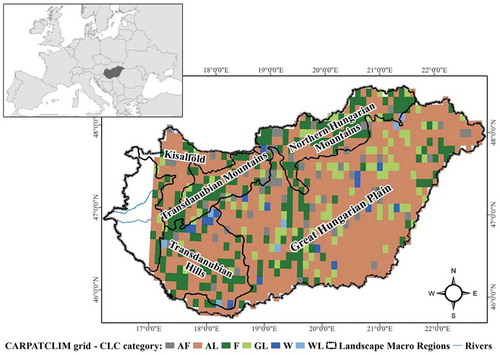
Table 1. Satellite based, climatic, topographic variables and spatial factors.
Figure 2. The workflow of the data processing.
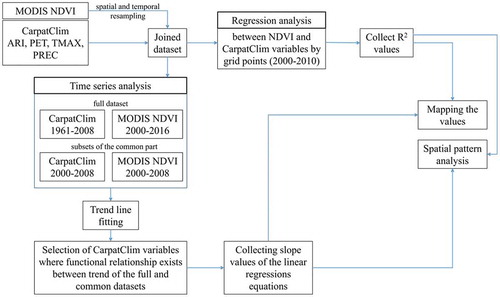
Table 2. Basic descriptive statistics of the determination coefficients (R2) of the linear regressions performed on the NDVI and the CARPATCLIM variables by POIs (in the period 2000–2010).
Figure 3. R2-values of the CC variables: a – TMAX; b – PET; c – ARI; d – PREC.
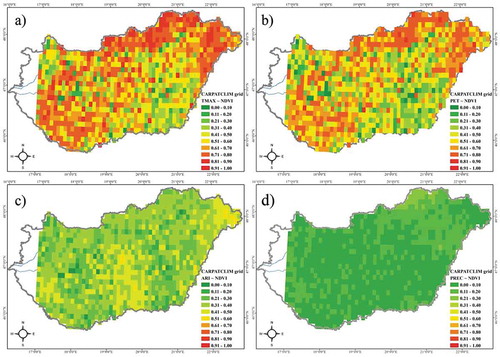
Figure 4. β-values of CC variables by POIs for the period 1961–2008; a – TMAX; b – PET; c – ARI; d – PREC.
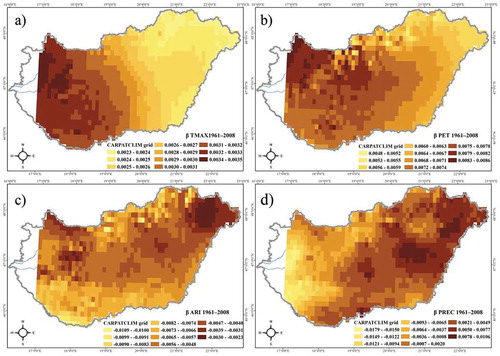
Table 3. Basic descriptive statistics of the CARPATCLIM variables and the NDVI, considering the β-values of the trend lines calculated by POIs for the periods 1961–2008 and 2000–2008.
Table 4. Determination coefficients of the regression analyses between the β-values of the trends (dependent variable: β-values for the period 1961–2008, independent variable: β-values for the period 2000–2008) (p < 0.05 is highlighted in bold).
Figure 5. Ordination diagram of the PCA performed on the R2-values of CARPATCLIM variables and the NDVI, by macro-region.
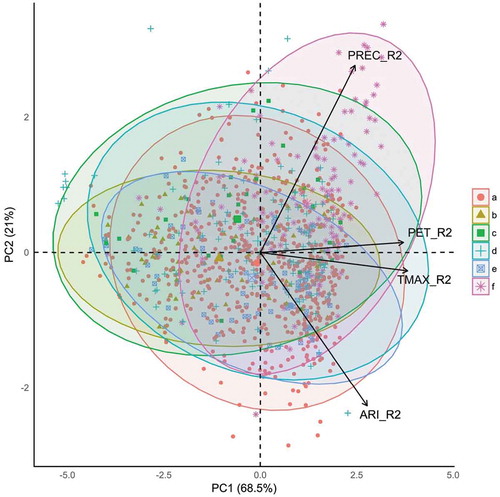
Table 5. Averaged R2-values of regressions between the NDVI and climatic variables by macro-regions (2000–2008).
Figure 6. Means with 95% confidence intervals of pairwise analysis of PC1 values (corresponding to R2 between the TMAX, PET and PREC and NDVI) by macro-region (confidence intervals including 0 are of non-significant differences, p > 0.05; GHP: Great Hungarian Plain, KA: Kisalföld, TH: Transdanubian Hills, TM: Transdanubian Mountains, NHM: North Hungarian Mountains).
Figure 7. Means with 95% confidence intervals of pairwise analysis of TMAX regression slope (β) values by macro-regions; slope values were multiplied by 100 referring to a wider period (confidence intervals including 0 are of non-significant differences, p > 0.05; GHP: Great Hungarian Plain, KA: Kisalföld, TH: Transdanubian Hills, TM: Transdanubian Mountains, NHM: North Hungarian Mountains).
Figure 8. Interaction plot of R2 of NDVI and TMAX by macro-regions and land cover (macro regions are ranked by the average terrain height, GHP: Great Hungarian Plain (101 m), KA: Kisalföld (128 m), TH: Transdanubian Hills (164 m), TM: Transdanubian Mountains (254 m), NHM: North Hungarian Mountains (258 m); F: forests, GL: grasslands, AF: artificial surfaces, AL: arable land; when lines are intersected, interaction plot indicates statistical interaction between two factorial variables, the macro-regions and land cover classes – ordinal rank is a prerequisite for this type of plot).
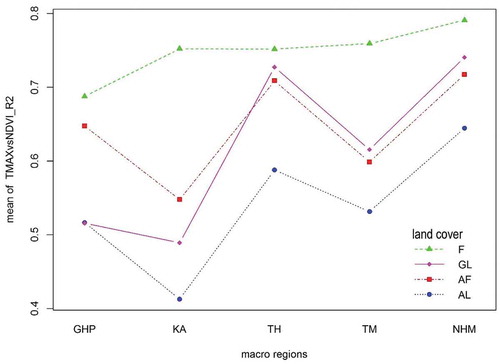
Table 6. Correlation (r) between the determination coefficients (R2) and topographic variables by POIs (p < 0.05 is highlighted in bold).
Table 7. Correlation (r) between the regression slope parameter (β) and topographic variables by POIs (p < 0.05 is highlighted in bold).