Figures & data
Figure 1. Location map for the selected lakes in San Angelo and Dallas. The Edwards Plateau Climate Division (marked with light red color) encompasses all lakes in the San Angelo study area, and the North Central Climate Division (indicated with light orange color) comprises the Dallas area lakes. All other climate divisions in Texas are marked with pale yellow color.
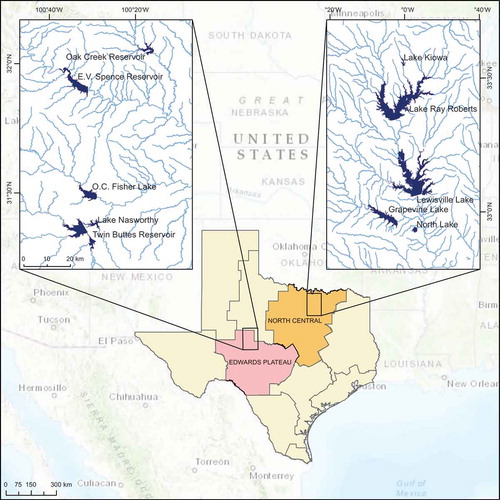
Table 1. Statistical results of the accuracy assessment (%) for the selected reservoirs in San Angelo.
Table 2. Statistical results of the accuracy assessment (%) for the selected reservoirs in Dallas.
Table 3. Seasonal oscillations (%) in the surface water area of the selected reservoirs in San Angelo. The percentage of surface water area change is calculated with respect to the total possible surface area prescribed by the Texas Water Development Board.
Figure 2. Surface water area oscillations in the O.C. Fisher Lake from winter acquisitions of each year during the study period (2005–2016). Dates are dd/mm/yyyy and the image from 2015 is used in the background because it has 0% cloud cover.
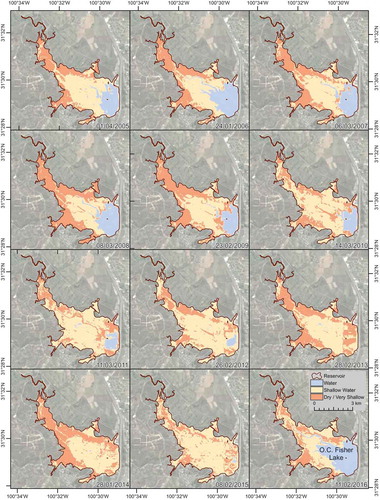
Figure 3. A comparison of oscillations in the surface water area and the volume of the E.V. Spence and the O.C. Fisher Lakes between 2005 and 2016.
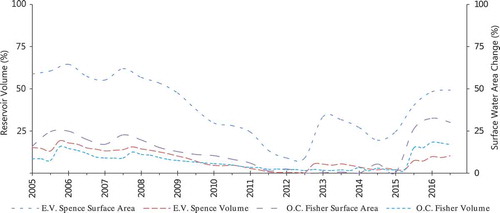
Table 4. Seasonal changes (%) in the surface water area of the selected reservoirs in Dallas during 2005–2016. The percentage of surface water area change is calculated with respect to the total possible surface area prescribed by the Texas Water Development Board.
Figure 4. Surface water area changes in the Grapevine Lake from winter acquisitions of each year during 2005–2016. Dates are dd/mm/yyyy and the image from 2015 is used in the background because it has no cloud cover.
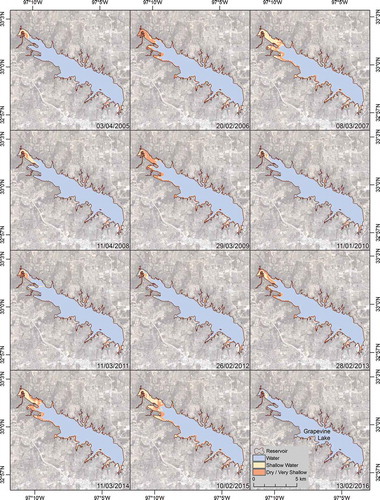
Figure 5. A comparison of oscillations in the surface water area and the volume of the Lewisville and the Ray Roberts Lakes.
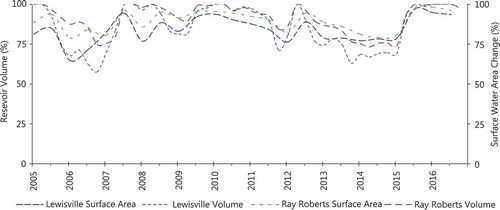
Figure 6. (a) Palmer drought indices for the Edwards Plateau climate division (marked with light red color in ) and surface water area changes in the San Angelo lakes. (b) Palmer drought indices for the North Central Texas division (marked with light orange color in ) and surface water area changes in the Dallas reservoirs.
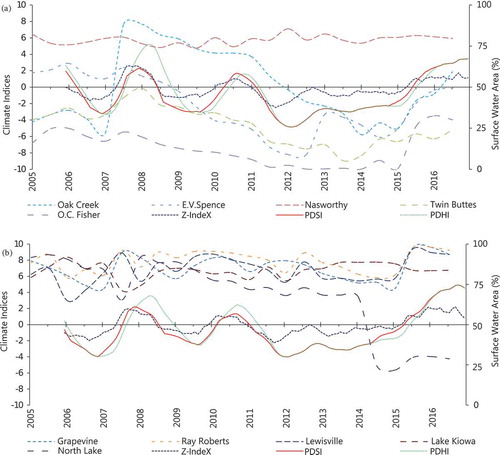
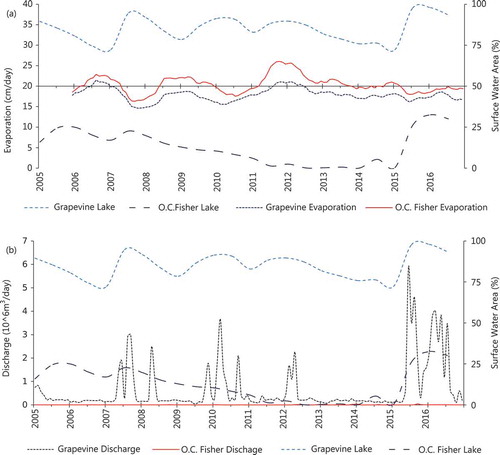
Figure 7. (a) The relationship between the surface water area and the average of evaporation recorded on site daily at the Grapevine and the O.C. Fisher Lakes by the Corps of Engineers and the Texas Water Development Board, respectively. (b) The relationship between changes in the surface water area and the average of daily discharge (the total m3/day) measured at the Grapevine and the O.C. Fisher Lakes by the Corps of Engineers and the Texas Water Development Board, respectively.