Figures & data
Figure 1. Sorrentina Peninsula Geological map (modified after Apuzzo et al. Citation2013).
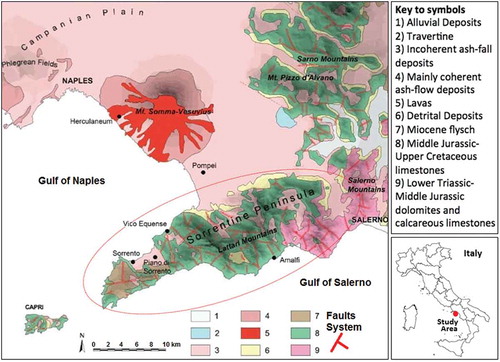
Figure 2. Methodological approach scheme.
Table 1. Elaborated SAR dataset details.
Table 2. SAR “a priori” visibility analysis: Terrain aspect and slope (SL) constraints for ASAR (a) and CSK (b) dataset.
Figure 3. InSAR “a priori” visibility: a) ASAR ascending; b) ASAR descending; c) CSK ascending; d) CSK descending.
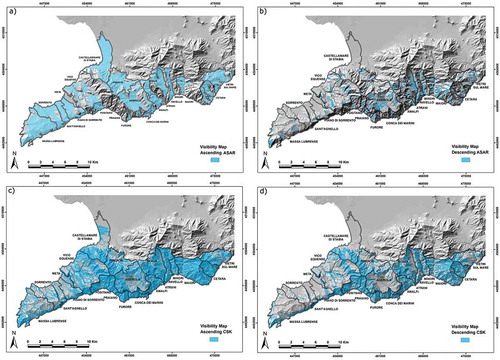
Figure 4. InSAR processing results on the entire Peninsula: (a) ASAR mean ground velocities map; (b) CSK mean ground velocities map.
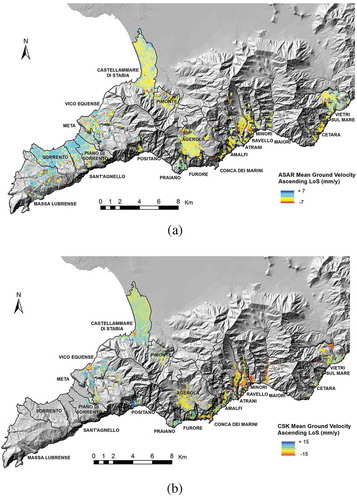
Table 3. Areal ground deformation coverage obtained by the combined ASAR and CSK InSAR processing versus municipalities.
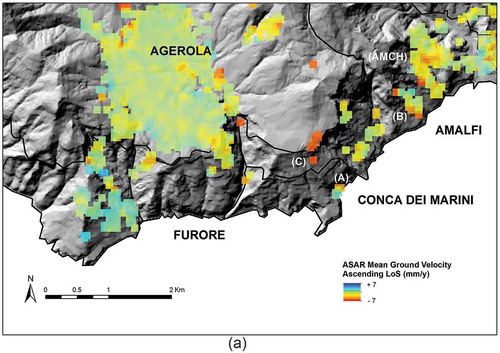
Figure 5. a) ASAR mean ground velocity map in Amalfi and Conca dei Marini; b) ASAR ground displacement time series for the selected sites (A, B, C and AMCH) obtained by meaning the adjacent pixels with ground velocity < –1 mm/y. c) 3D reconstruction of ASAR mean ground velocity in Conca dei Marini; d) 3D reconstruction of ASAR mean ground velocity of in Amalfi.
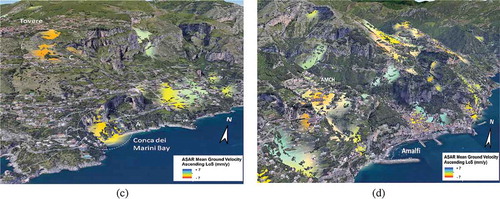
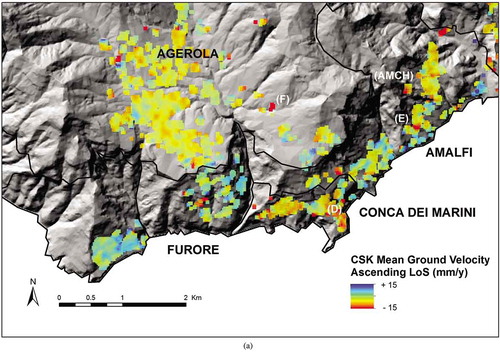
Figure 6. a) CSK mean ground velocity map in Amalfi and Conca dei Marini; b) CSK ground displacement time series for the selected sites (D, E, F and AMCH) obtained by meaning the adjacent pixels with ground velocity < −1 mm/y.
Table 4. GPS reference stations and surveyed Ground Control Points (GCP) coded names and characteristics. Reference stations are equipped with Leica GRX1200+ receiver and LEIAT 504 antenna (choke ring). GCPs have been measured by Leica GX1230 receiver and LEIAX1202 antenna. The AMCH has been used as reference point in the GEP procedure during ASAR processing.
Figure 7. Aerial image and interpretation of Amalfi and Conca dei Marini area. The numbers 1 and 2 indicate the position of the sites shown in and , respectively. The inset shows the 6 aerial images coverage and their respective numbers.
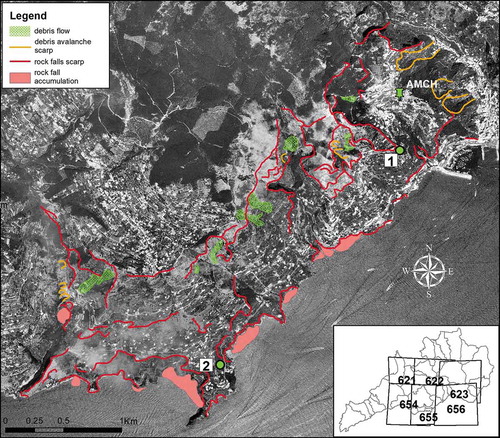
Figure 8. GPS surveyed points map.
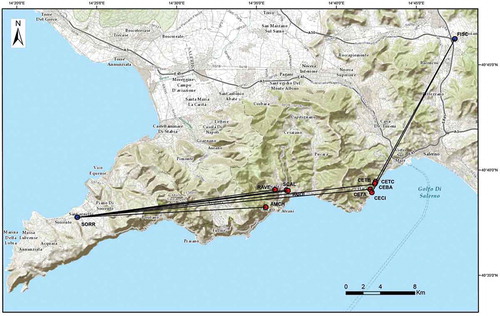
Figure 9. Fieldwork pictures; a) Amalfi upper sector above harbor site; b) Conca dei Marini bay site.
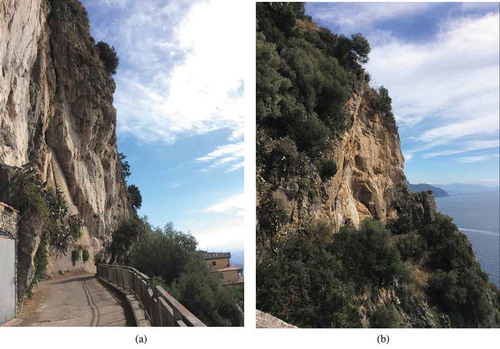
Table 5. LSI parameters. For each selected parameter the table reports the acronym the assigned weight (Pi), the classes (j) with the respective weights (Wij).
Figure 10. Susceptibility parameters statistical histograms in the deformation areas of Amalfi and Conca dei Marini.
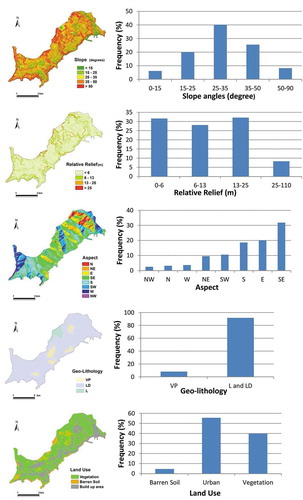
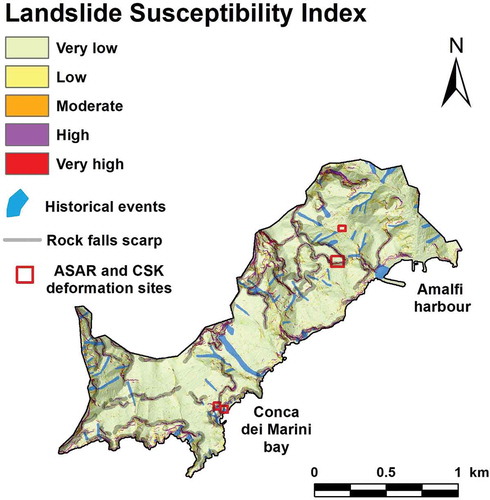
Figure 11. Amalfi and Conca dei Marini LSI resulting Map.