Figures & data
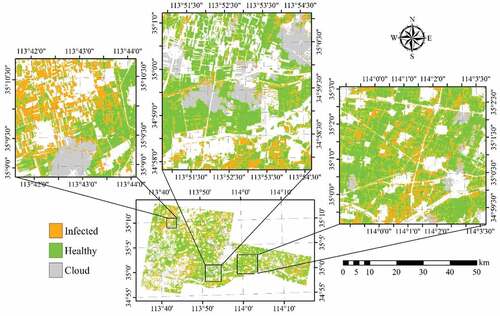
Figure 8. Spatial distribution of YR infected winter wheat derived by SVM with the RapidEye images acquired on May 10 and 23, 2017. Areas in white represent non-wheat fields.
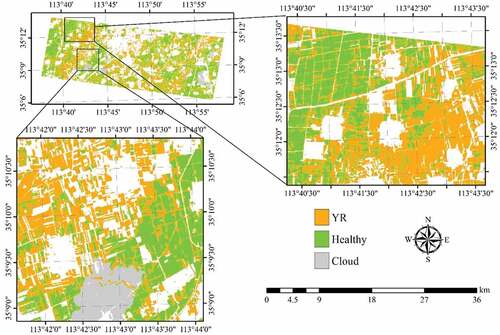
Figure 1. Study area and sample distribution.
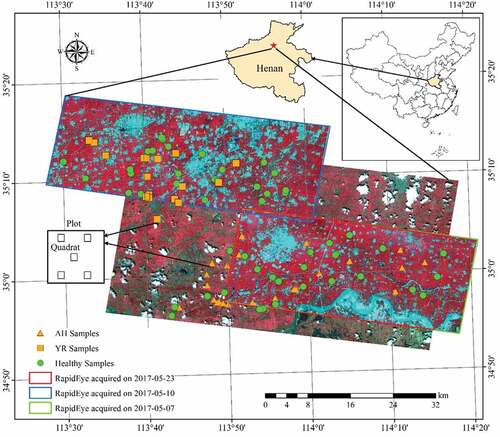
Table 1. Specifications of the RapidEye Multi-spectral imager bands.
Table 2. Specifications of RapidEye data acquisitions and corresponding phenological stage of winter wheat.
Table 3. List of selected vegetation indices.
Table 4. Summary for the use of sampling plots.
Table 5. Correlation coefficient between different vegetation indices.
Figure 2. Average canopy reflectance of the three classes of winter wheat samples derived from the 23 May 2017 RapidEye image. Vertical error bars represent the standard deviation.
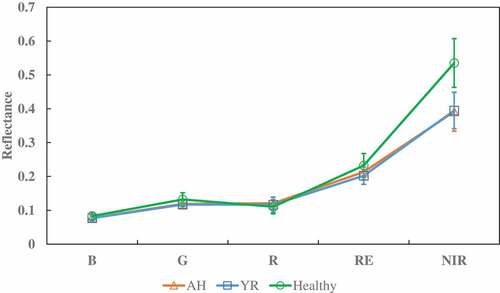
Figure 3. Average vegetation indices of the three classes of winter wheat samples derived from the May 23, 2017 RapidEye image; vertical error bars represent the standard deviation.
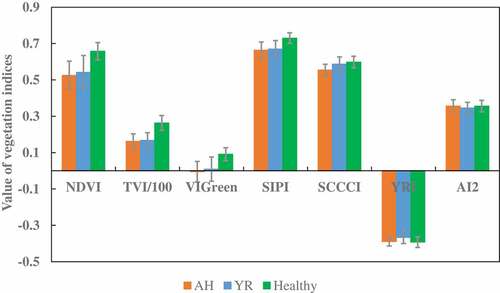
Figure 4. Importance of variables for disease/pest identification, computed using RF. The left panel is for YR detection using RapidEye image acquired on 10 May 2017, and the right panel is for AH detection using RapidEye image acquired on 7 May 2017.
Figure 5. Boxplots of the overall accuracy (OA) of the three algorithms for detection of YR infection using RapidEye image acquired on 10 May 2017, using the10-fold cross-validation. The thick horizontal lines represent the median, the top and bottom of the box represent the 25th and 75th percentiles, and the whiskers are 1.5 times of the box height towards upper and lower from the median. Dark circles represent the average of OA.
Figure 6. Distribution of YR infected winter wheat area derived from SVM using the RapidEye imagery acquired on 10 May 2017. Areas in white represent non-wheat fields.
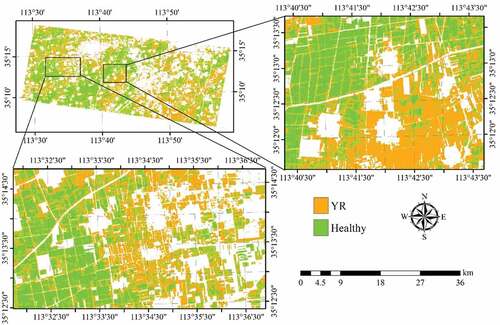
Figure 7. Boxplots of the overall accuracy (OA) of the three algorithms for detection of YR infection using RapidEye image acquired on May 10 and 23, 2017, using the10-fold cross-validation. The thick horizontal lines represent the median, the top and bottom of the box represent the 25th and 75th percentiles, and the whiskers are 1.5 times of the box height towards upper and lower from the median. Dark circles represent the average of OA.
Figure 9. Boxplots of the overall accuracy (OA) of the three algorithms for detection of AH infection using RapidEye image acquired on 7 May 2017, using the10-fold cross-validation. The thick horizontal lines represent the median, the top and bottom of the box represent the 25th and 75th percentiles, and the whiskers are 1.5 times of the box height towards upper and lower from the median. Dark circles represent the average of OA. Open circles are outliers.
Figure 10. Spatial distribution of AH infected winter wheat derived by SVM with RapidEye imagery acquired on 7 May 2017. Areas in white represent non-wheat fields.
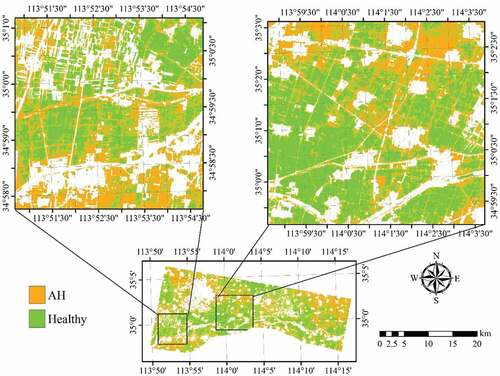
Figure 11. Boxplots of the overall accuracy (OA) of the three algorithms for detection of AH infection using RapidEye image acquired on May 7 and 23, 2017, using the10-fold cross-validation. The thick horizontal lines represent the median, the top and bottom of the box represent the 25th and 75th percentiles, and the whiskers are 1.5 times of the box height towards upper and lower from the median. Dark circles represent the average of OA.
Figure 12. Distribution of AH infected winter wheat derived by SVM with RapidEye imageries acquired on May 7 and 23, 2017. Areas in white represent non-wheat fields.
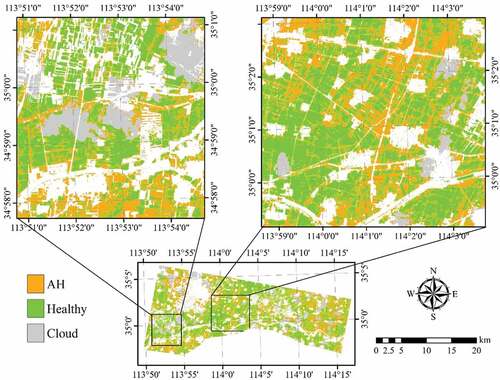
Figure 13. Boxplots of the overall accuracy (OA) of the three algorithms for detection of AH and YR infection using RapidEye image acquired on May 7 23, 2017, using the10-fold cross-validation. (a) for “AH vs. YR vs. Healthy,” (b) for “Infected vs. Healthy.” The thick horizontal lines represent the median, the top and bottom of the box represent the 25th and 75th percentiles, and the whiskers are 1.5 times of the box height towards upper and lower from the median. Dark circles represent the average of OA. Open circles are outliers.
Figure 14. Distribution of Infected winter wheat derived by SVM with RapidEye image acquired on 23 May 2017. Areas in white represent non-wheat fields.