Figures & data
Figure 1. Flowchart of the LSTM-based time series analysis method for crop classification.
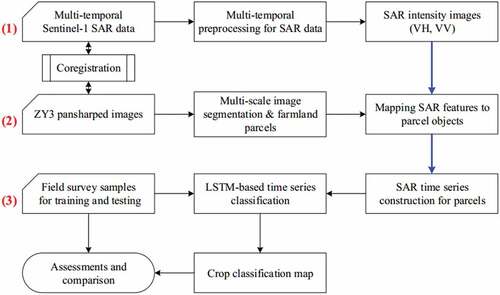
Figure 2. Farmland parcels and field survey samples for crop classification.
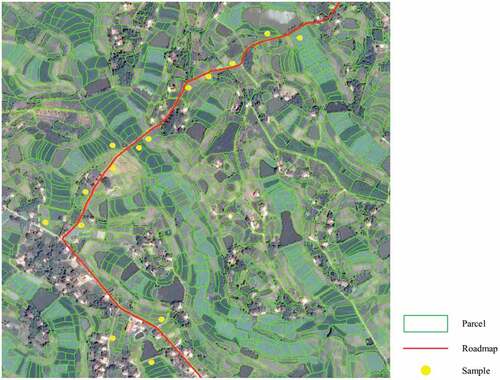
Table 1. Sentinel-1 SAR data list used in this study (the data between DOY 154 and DOY 178 is missing).
Figure 3. Sample augmentation for LSTM-based classification.
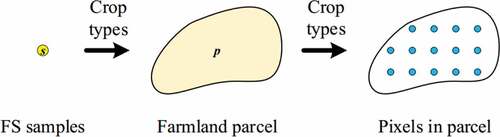
Figure 4. Network structure of the LSTM-based classifier used for time series analysis.
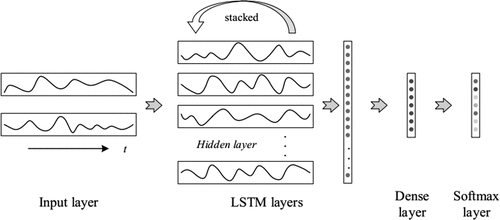
Figure 5. The study area in northern Hunan Province, China. The right-hand section provides an overview of the SAR data (R: 23 May 2017 VH polarization, G: 26 October 2017 VH polarization, B: 3 August 2017 VV polarization), roadmaps and sample spots of the field survey.
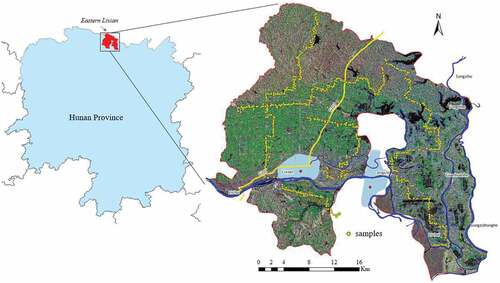
Figure 6. Results of parcel-based crop classification for Hunan using the proposed method.
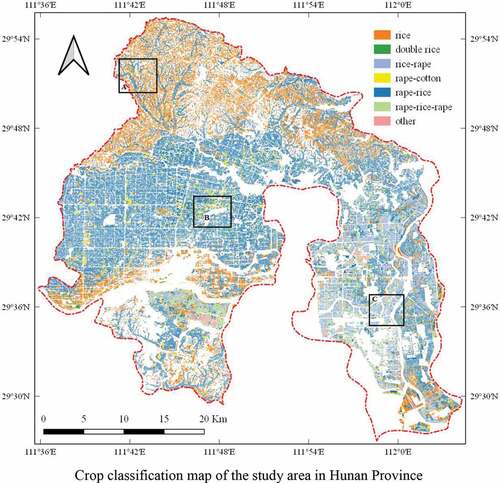
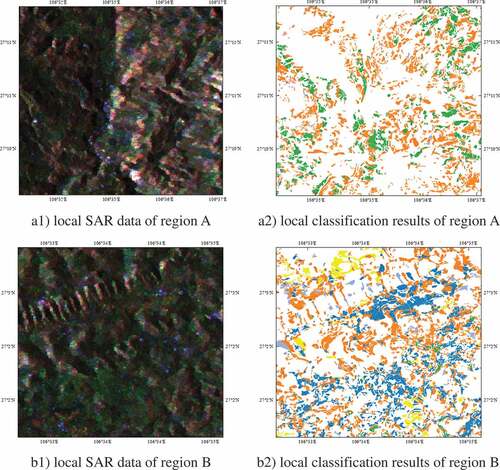
Figure 7. Local details of parcel-based crop classification for Hunan using the proposed method.
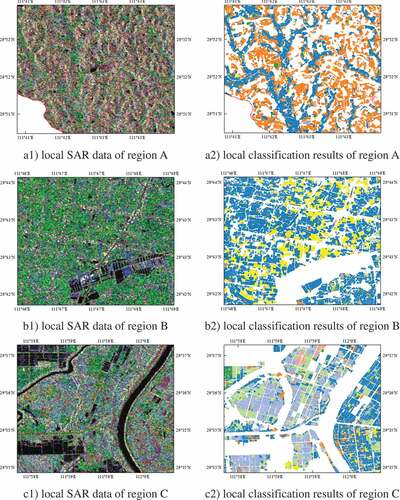
Table 2. Comparison of overall accuracy, kappa coefficient and F1 measure values conducted using the SVM-, RF-, and LSTM-based classifiers for Hunan.
Figure 8. VH intensity time-series curves for crops (the upper section) and their corresponding crop calendars (the lower section) for Hunan.
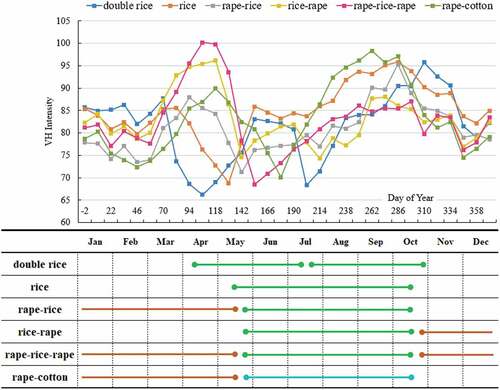
Table 3. Classification performance using multivariate and univariable time series for Hunan.
Figure 9. Classification performance as a function of the number of neurons in hidden layers.
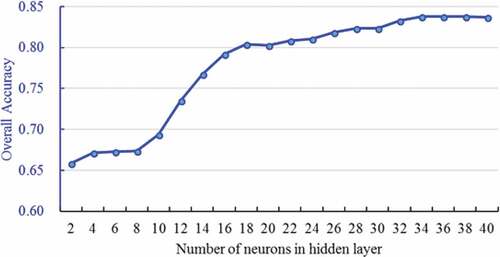
Figure 10. Classification performance as a function of time series.
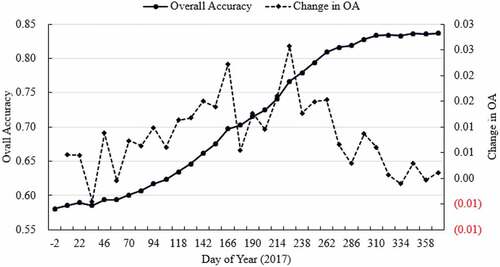
Table 4. Comparison of overall accuracy values for Guizhou using the SVM-, RF-, and LSTM-based classifiers.
Figure 11. Results of the parcel-based crop classification for Guizhou using the proposed method.
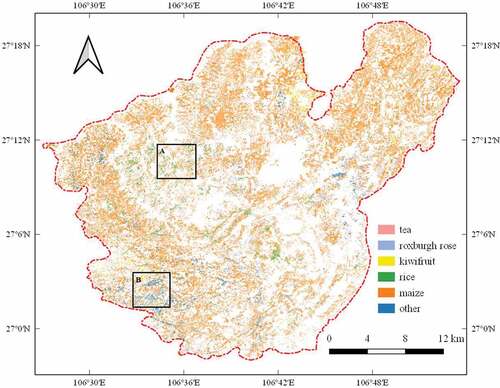
Figure 12. Local details of the parcel-based crop classification for Guizhou using the proposed method.