Figures & data
Figure 1. Locational map of the study area.
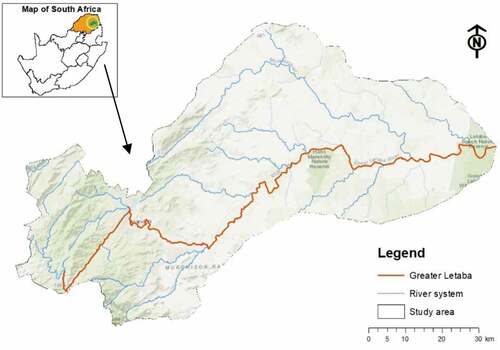
Table 1. Dry and wet season Sentinel-2 MSI acquisition dates used.
Figure 2. Methodological framework.
Table 2. Sentinel-2 MSI spectral bands and vegetation indices used for this study.
Table 3. Sentinel-2 MSI experimental measures of accuracy assessment for water hyacinth.
Figure 3. Averaged spectral reflectance derived from Sentinel-2 MSI (a) wet season and (b) dry season.
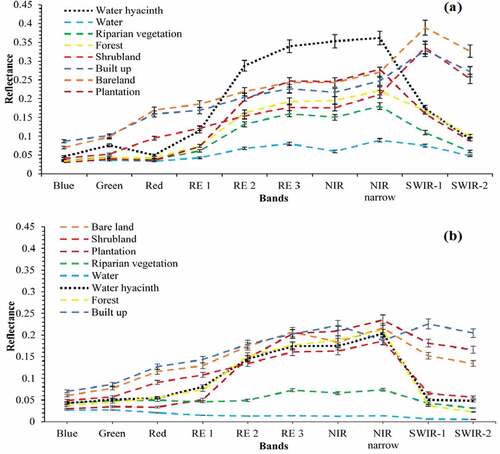
Table 4. Confusion matrix derived using spectral bands for a) wet season and b) dry season showing the overall classification accuracy, user and producer accuracy for discrimination of water hyacinth amongst other land cover types derived using test data.
Table 5. Confusion matrix derived using vegetation indices for a) wet season and b) dry season showing the overall classification accuracy, user and producer accuracy for discrimination of water hyacinth amongst other land cover types derived using test data.
Table 6. Confusion matrix derived using combined spectral bands and vegetation indices for a) wet season and b) dry season showing the overall classification accuracy, user and producer accuracy for discrimination of water hyacinth amongst other land cover types derived using test data.
Table 7. Magnitude of classification accuracies of wet and dry season derived from Sentinel-2 MSI.
Figure 4. Combined spectral bands and vegetation indices overall classification accuracies derived during wet and dry season from Sentinel-2 MSI.
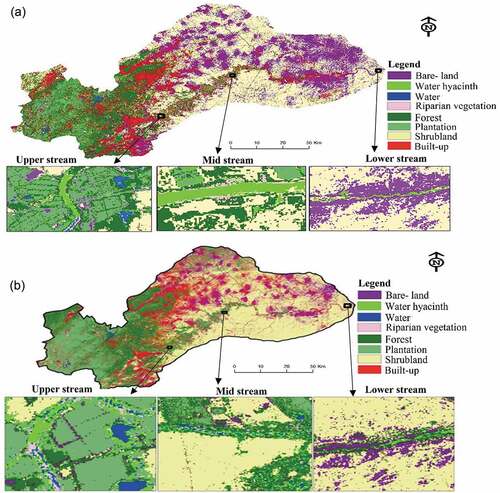
Figure 5. Seasonal maps derived using Sentinel-2 MSI (a) wet season and (b) dry season.