Figures & data
Figure 1. Study site location, elevation map, and data used for the study. Numbers in the bottom legend refer to the 12 vegetation series (see for definitions). “Others” represents vegetation series along streams and among rock falls, covering less than 5% of the study site.
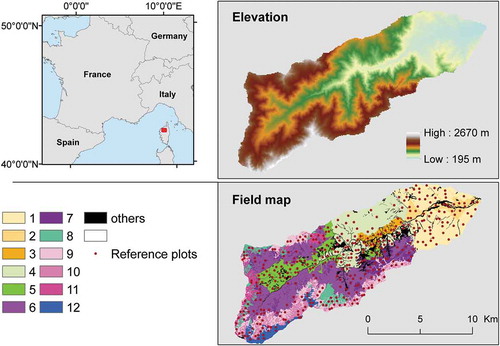
Figure 2. Methodological flowchart.
Table 1. Classification and number of reference plots for each vegetation series (see Table S1 for a detailed description of vegetation series).
Figure 3. Decrease in the normalized Gini index (the sum of all spectral variable indices equaled one) for each spectral band obtained from the random forest classifier; larger values indicate greater importance.
Figure 4. Modeling accuracy (median Kappa index) as a function of the number of dates selected (ranked in decreasing order of importance). The gray area indicates the standard deviation, while the vertical dotted line indicates the number of dates selected for the final RF model.
Table 2. Cross-validated (fivefold, repeated three times) confusion matrix between the modeling of 12 vegetation series derived from the MODIS time-series (rows) and the validation reference plots (columns). Entries are total cell counts across resamples.
Figure 5. (a) Structural and (b) functional maps of vegetation series derived from the MODIS satellite images. Numbers in the legend refer to the 12 vegetation series (see for definitions).
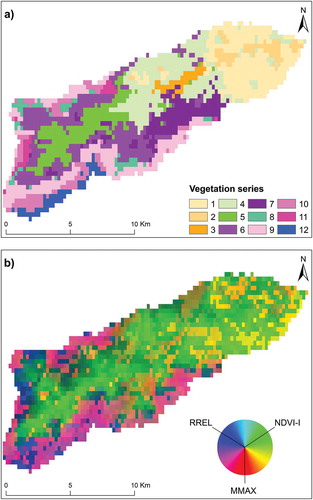
Figure 6. Ordination diagram of principal component analysis (PCA). Vectors show the direction and importance of functional indices. Confidence ellipses (p = 0.9) are drawn around the barycenters of vegetation series, each of which is represented by a code number. Mediterranean vegetation series are black, while sub-alpine and alpine vegetation series are gray.