Figures & data
Figure 1. The location of the study area: (a) in KwaZulu-Natal Province, South Africa and (b) its overview from Sentinel 2 natural band composition (bands 4, 3 and 2), the spatial distribution of the sampled points and the location of a weather station, from which some of the data used were recorded.
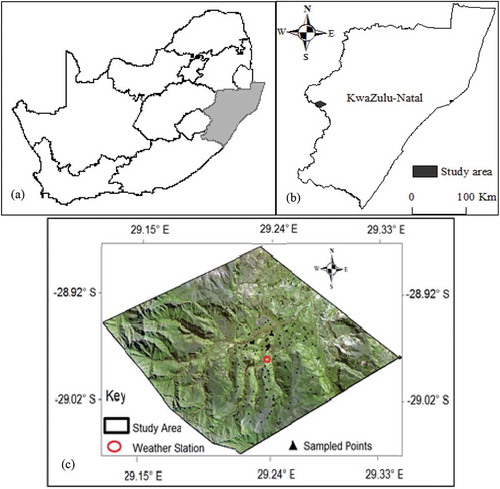
Figure 2. Flowchart showing the methodological procedure followed in the study. The highlighted boxes indicated the stages at which statistical tests were performed.
Table 1. Sentinel 2A image data characterization.
Table 2. Sentinel 2A image acquisition date (Julian day format) in 2016 and their characteristics.
Table 3. Test of significant difference results in spectral response between the two species over time.
Figure 3. Species spectral response curves for summer (a-d) and winter e-h. Red boxes show the bands with separable spectral response.
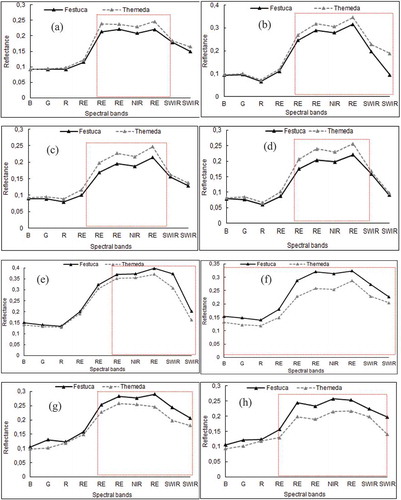
Figure 4. Derived: (a) overall accuracies, (b) classification errors and (c) species areal coverage in relation to monthly rainfall and temperature.
Figure 5. Spectral bands frequency in discriminating C3 and C4 over time.
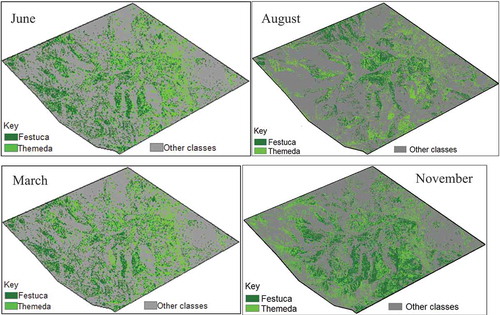
Figure 6. The spatial distribution of C3 and C4 grass species across the study area using images acquired at different seasonal periods in 2016.