Figures & data
Figure 1. The schematic diagram illustrating the interaction of solar radiation between atmospheric aerosols and terrestrial vegetation according to Kanniah et al. (Citation2012).
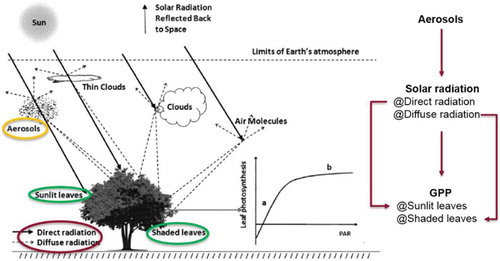
Figure 2. The location of North China and the distribution of two ecosystems, 16 meteorological and radiometric stations and two validation sites in the study area. The study area is defined by Xu et al. (Citation2015), who have divided China into six regions including North China (NC), Southwest (SW), Southeast (SE), Northeast (NE), Northwest (NW) China and the Tibet Plateau (TP).
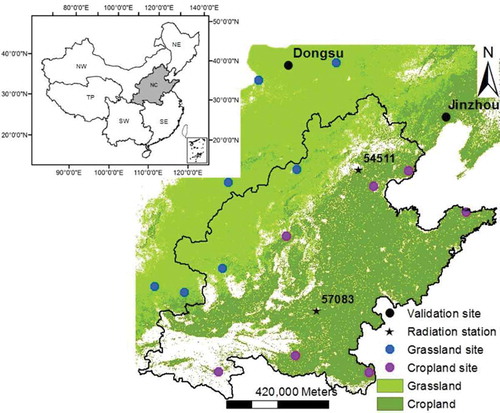
Table 1. Initial values of the required parameters to model GPP using BEPS at 14 sites.
Figure 3. Scatterplots of daily diffuse radiation estimated by the original and the improved empirical method against the field measurements at two stations in North China under S1 (ab) and S2 (cd) aerosol scenarios.
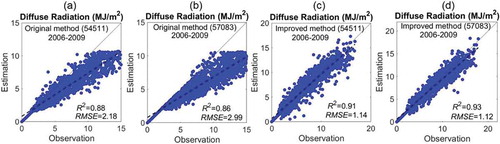
Figure 4. Seasonal difference of hourly diffuse radiation under two aerosol scenarios (S1& S2).
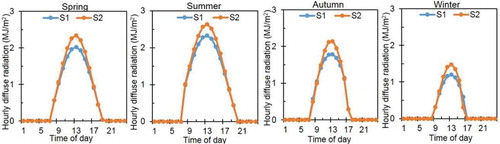
Figure 5. Validation of eight-day total GPP modeled by BEPS under two aerosol scenarios (S1& S2) at Jinzhou (cropland ecosystem) site and Dongsu (grassland ecosystem) site. N is the number of available measurements of eight-day total GPP.
Figure 6. Four-year average changing rate in GPP (△GPP (%)) of the sunlit and shaded leaves above and below the canopy under two aerosol scenarios at each site. (a) Overstory sunlit GPP, (b) overstory shaded GPP, (c) understory sunlit GPP and (d) understory shaded GPP refer to GPP of the sunlit and shaded leaves above and below the canopy.
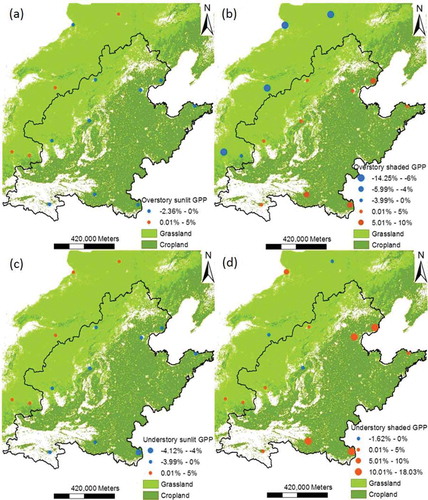
Figure 7. Annual total GPP and the change of GPP (△GPP, gCm−2yr−1) averaged from seven cropland ecosystem sites under two aerosol scenarios. Significance levels are suggested as * = 0.05 and ** = 0.01.
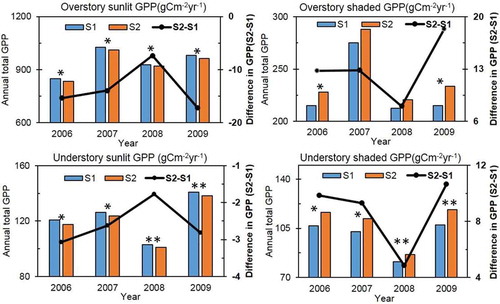
Figure 8. Eight-day total GPP and change in GPP (△GPP, gCm−28d−1) averaged from seven cropland ecosystem sites under two aerosol scenarios. Significance levels are suggested as * = 0.05 and ** = 0.01 and DOY indicates the day of year.
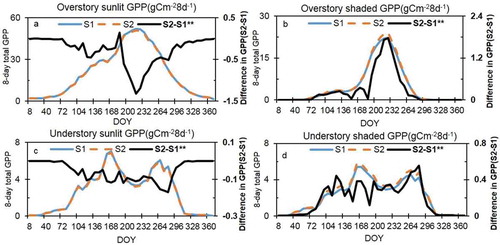
Figure 9. Linear regression between the increase of daily total GPP (△GPP, gCm−2d−1) and daily diffuse fraction in S2 during the growing season at seven cropland ecosystem sites for 2007.
Figure 10. Scatterplots of daily diffuse fraction against daily AOD from two stations.
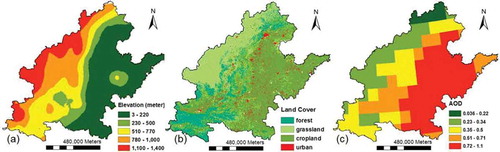
Figure 11. The distribution of elevation, aerosol concentration and land cover in North China according to Feng et al. (Citation2018a).