Figures & data
Figure 1. Location of Jeollanam Province and Gwangyang City, with the boundary of Landsat tile, based on the continuous cadastral map in Jan 2018 (on the left side) and Landsat 7 band 1 image on 15 October 2000 (on the right side).
Table 1. List of Landsat 7 images containing reference samples.
Figure 2. Google Earth high-resolution satellite images (24 October 2013) of the three categories of abandoned farmland.
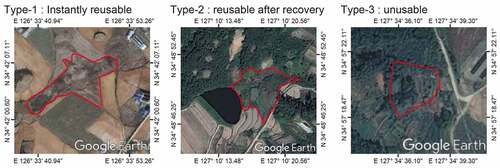
Figure 3. Location of reference samples in Gwangyang City, based on Landsat 7 band 1 image on 15 October 2000.
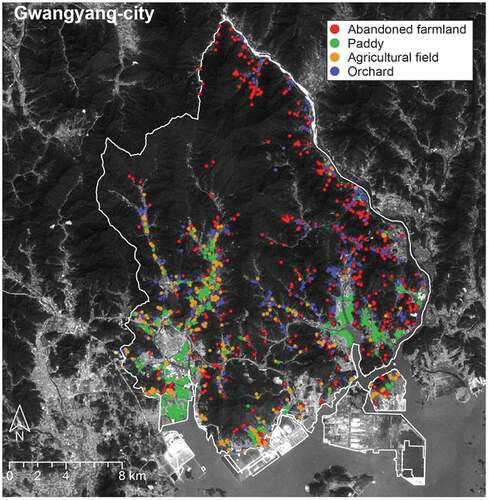
Figure 4. Crop calendar in Gwangyang City.
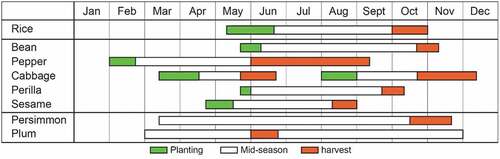
Figure 5. Google Earth high-resolution satellite images (24 October 2013) of reference samples for four agricultural types.
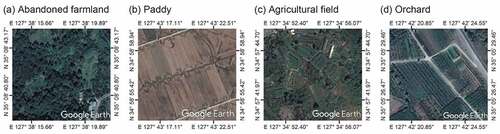
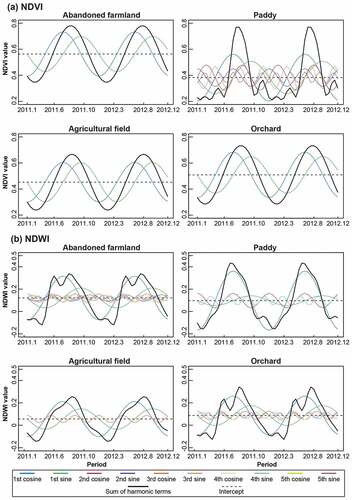
Figure 6. Average vegetation indices with their 95% confidence intervals, showing annual change over 2 years, for all 400 reference samples by agricultural type.
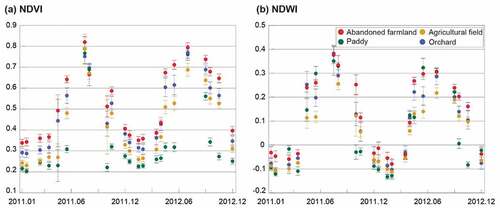
Table 2. The set of statistically significant harmonic components for each agricultural type and for NDVI and NDWI.
Figure 7. Curves of statistically significant harmonic terms and the composite curve for each agricultural type.