Figures & data
Table 1. Minimum and maximum concentrations of pollutants around air monitoring stations.
Figure 1. Air pollution sources and industry density map in study area.
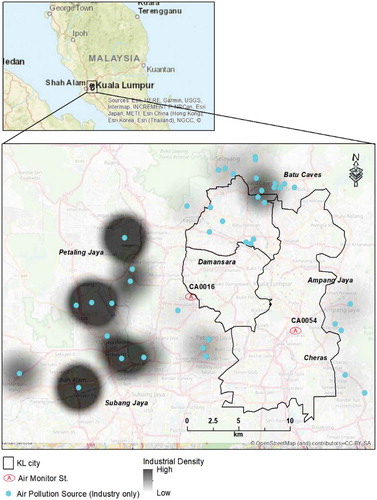
Figure 2. Missing data summary (a) CA0054 and (b) CA0016 and the pattern of the missing data (c) CA0054 and (d) CA0016 along the data record period of the mean values of the pollutants for the period 2007 to 2016. (Yellow color indicates missing data while blue color indicates existing data).
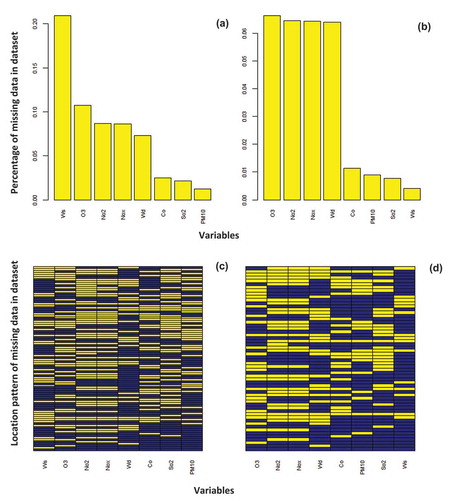
Figure 3. (a) PM10 percentile distribution at CA0016 and (b) PM10 percentile distribution at CA0054. X-axis represents percentile unit while y-axis represents the frequency of the units.
Figure 4. Elbow algorithm to show the best number of clusters in CA0016 station using normalize percentiles quantiles of (a) SO2; (b) PM10; (c) CO.
Figure 5. Summary plot shows the mean values of the pollutants for the period 2007 to 2016 (a) CA0016, (b) CA0054.
Where “0%” in the bracket behind the missing value refers to ratio of missing data ([number of missing days’ record]/[total record period]) using real number precision.
![Figure 5. Summary plot shows the mean values of the pollutants for the period 2007 to 2016 (a) CA0016, (b) CA0054.Where “0%” in the bracket behind the missing value refers to ratio of missing data ([number of missing days’ record]/[total record period]) using real number precision.](/cms/asset/5804174e-55bc-4182-ab3b-a36b6457c369/tgrs_a_1712064_f0005_oc.jpg)
Figure 6. Pairplot relationship between CO, PM10, humidity, and SO2 (a) CA0016 (b) CA0054.
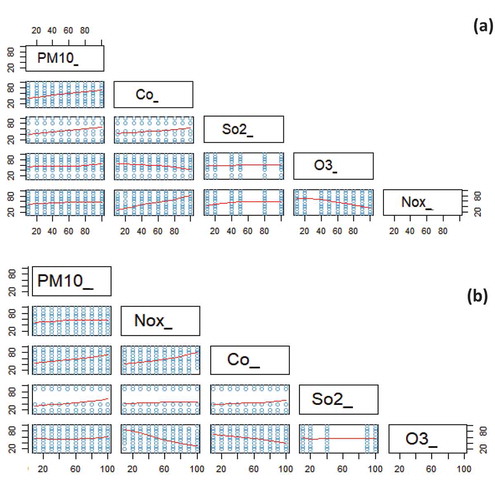
Figure 7. Decision tree using Rpart algorithms using 1000 randomly selected hours (a) CA0016 (b) CA0054.
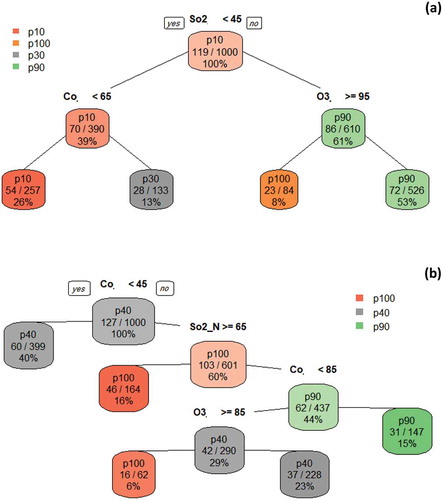
Table 2. Pollutants’ relative importance according to PM10 using random forest results.
Figure 8. Polar cluster plot for CA0016 and CA0054 stations.
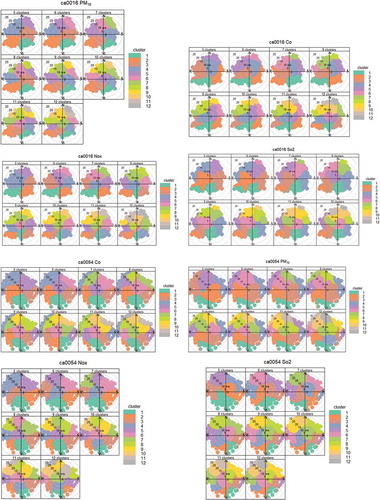
Figure 9. Polar plot with cluster instead of wind speed.
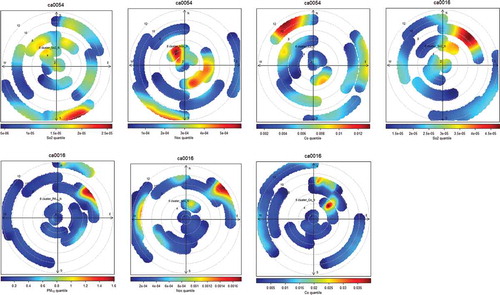
Figure 10. The Theil-Sen function plot for CA0016 and CA0054 stations. Y-axis represents the values of concentrations and X-axis represents the time in years.
Note also that the symbols shown next to each trend estimate relate to how statistically significant the trend estimate is: p < 0.001 = ∗ ∗ ∗, p < 0.01 = ∗∗, p < 0.05 = ∗, and p < 0.1 = +.
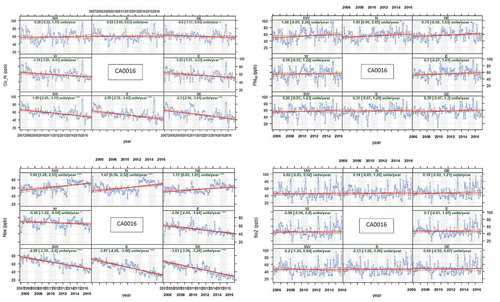
Figure 10. (Continued).
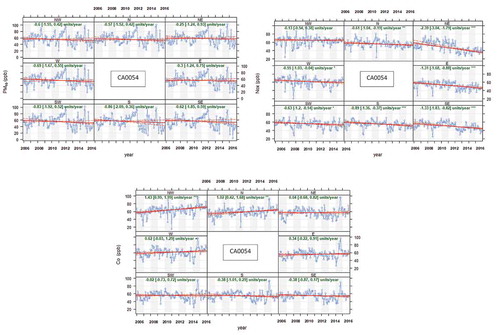
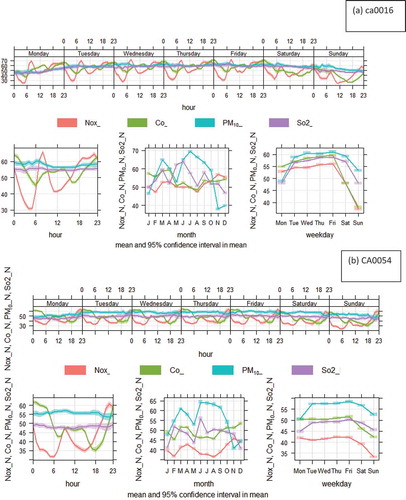
Figure 11. TimeVariation function for normalized concentrations of NOx, CO, SO2, and PM10 for (a) CA0016, (b) CA0054. Y-axis represents the normalized values of concentrations and X-axis represents the time in hour, months, and days.