Figures & data
Figure 1. Geographic location of the study site and five main deserts of the South Gobi region.
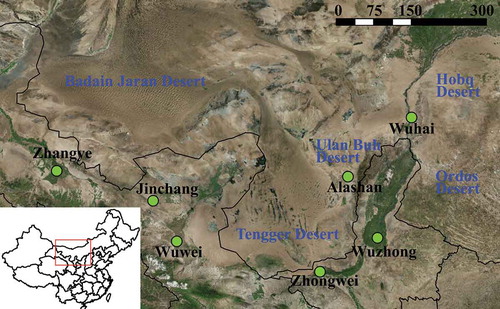
Table 1. Annual average concentrations (±standard deviation) of air pollutants (µg/m3 for PM2.5, PM10, NO2, SO2 and mg/m3 for CO) in the seven cities.
Figure 2. Seasonal mean concentrations of pollutants in the seven cities.
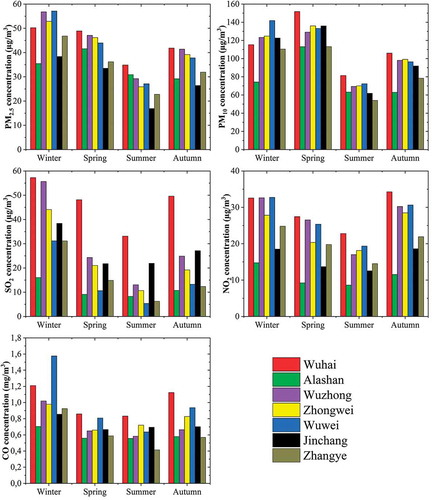
Figure 3. Mean ((a) and seasonal (b) – winter, (c) – spring, (d) – summer, (e) – autumn) AOD change (550 nm) in the South Gobi region for 2016–2018.
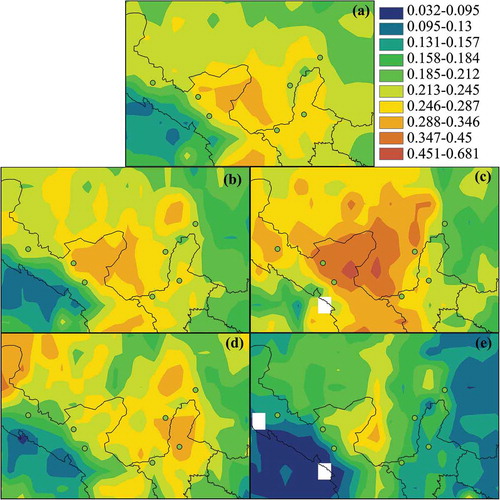
Figure 4. Frequency distribution (in %) of AOD in the region.
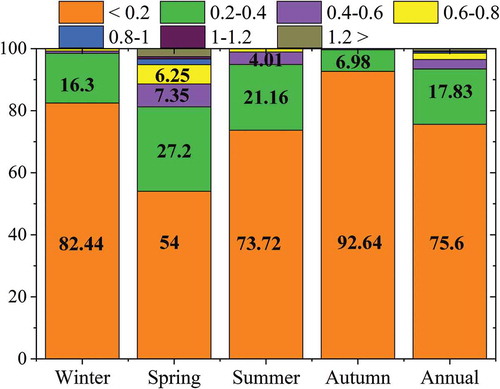
Figure 5. Contour density maps of the AOD (550 nm) versus AE (440–870 nm) in the period 2016–2018 for indicating major aerosol type in the South Gobi region. Figures in brackets demonstrate a percentage of each type of aerosols in the total amount for the entire study period.
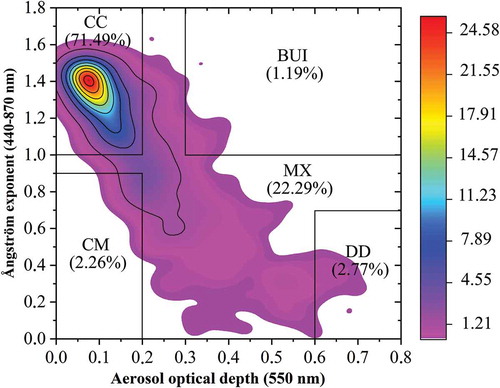
Figure 6. Spatial distributions of daily average MODIS AOD during dust event days over China on 3–4 May 2017 and 2–3 December 2018. Color lines demonstrate 72-h backward trajectories of air masses arriving in the cities (3 May 2017 – Jinchang, 4 May 2017 – Wuhai and Alashan, 2–3 December 2018 – Wuwei, Zhongwei and Wuzhong) at a height of 500 m (red line), 1500 m (blue line), and 2500 m (green line).
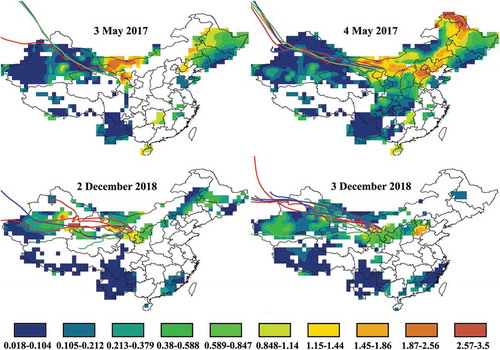
Figure 7. Spatial distribution of OMI UV aerosol index (UVAI) during the dust storm in the territory of continental China on 3–4 May 2017.
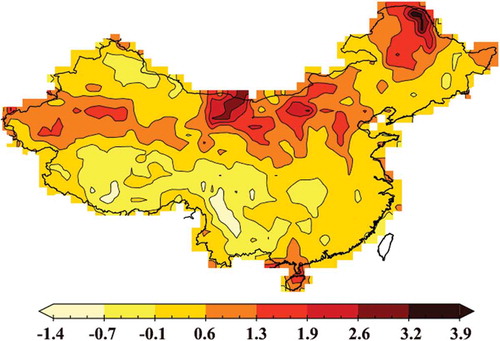
Figure 8. Spatial distribution of OMI Aerosol Absorbing Optical Depth (AAOD) during the two dust storms in the period of 3–4 May 2017 and 2–3 December 2018.
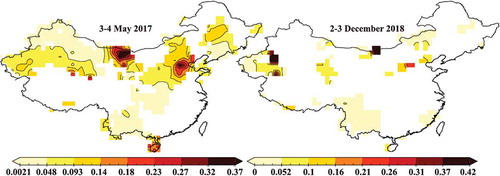
Figure 9. Temporal variation of OMI SSA at 388 nm during dusty days and non-dusty days during 2–6 May 2017 and 1–5 December 2018 in the South Gobi.
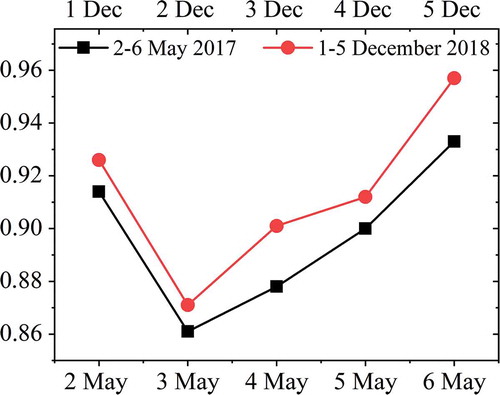
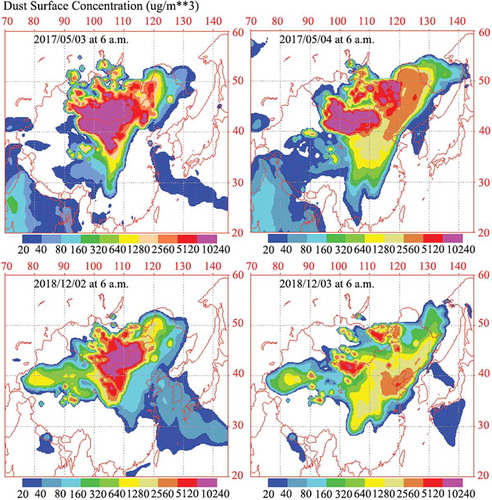
Figure 10. The Navy Aerosol Analysis and Prediction System (NAAPS) simulated surface level dust concentration (µg/m3) on 2–3 May 2017 and 2–3 December 2018 at 6 a.m. (UTC).