
Figures & data
Table 1. Datasets used in research.
Figure 1. Framework of mapping impervious surface at national scale using the combination of multiple-source remotely sensed data (Note: ISA, impervious surface area; VIIRS DNB, Visible Infrared Imaging Radiometer Suite Day/Night Band; MODIS NDVI, Moderate Resolution Imaging Spectroradiometer/normalized difference vegetation index; NDVImax, maximum NDVI value of MODIS NDVI time-series data; MNDWI, Modified Normalized Difference Water Index; OLI, Operational Land Imager).
Figure 2. Comparison of different remotely sensed data and products in Urumqi (a) and Shanghai (b). (1) VIIRS DNB with 500-m cell size; (2) (1–NDVImax) image with 250-m cell size; (3) ISAI image with 250-m cell size; (4) the initial ISA image using the thresholding approach based on ISAI with 250-m cell size; (5) the ISA result from Landsat with 30-m cell size (Note: the pixel values in a1–a3 and b1–b3 are continuous values between 0 and 1; the pixel values in a4–a5 and b4–b5 are categorical values of 1 (ISA in red) and 0 (non-ISA in white)).
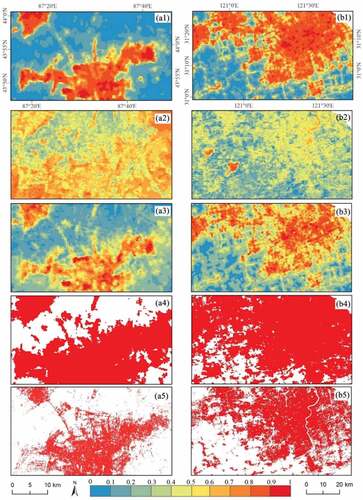
Figure 3. Spatial distribution of fractional impervious surface areas in China in 2015 at cell size of 1 km by 1 km, highlighting cities of (a) Urumqi, (b) Lanzhou, (c) Beijing, (d) Chengdu, (e) Guangzhou, and (f) Shanghai (note: the ISA value here is a proportion of ISA in a pixel, its values are within 0–1).
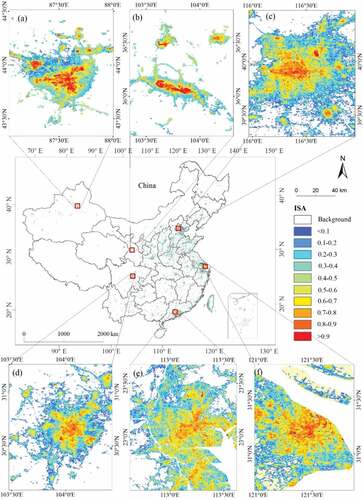
Table 2. Accuracy assessment results of mapping impervious surface area (ISA) in China.