
Figures & data
Figure 1. Study areas: (a) Bila Tserkva, (b) Mironivka (c) Yahotyn districts.
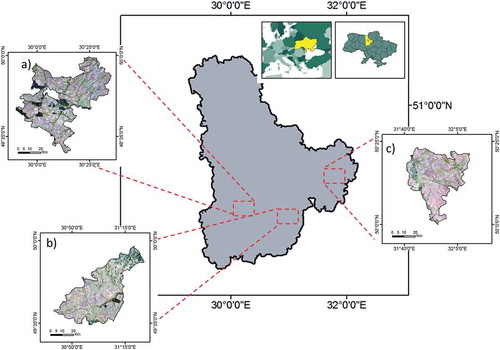
Figure 2. Accumulated values of precipitation during the main crop growth period between April and September in (a) Bila Tserkva, (b) Mironivka (c) Yahotyn regions.
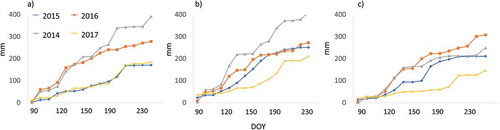
Figure 3. Workflow for drought-induced crop condition monitoring using multi-sensor data (RS stands for Remote Sensing, LST for Land Surface Temperature, RSM for Relative surface moisture).
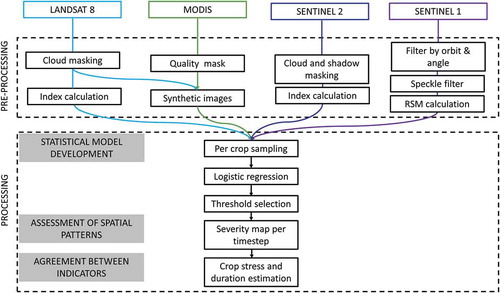
Table 1. Main RS indicators tested for agricultural drought monitoring, where L8 stands for Landsat 8 observations, S2 for Sentinel 2, S1 for Sentinel-1, and L8+ MOD for Synthetic Landsat products.
Figure 4. NDVI/LST density plots for (a) maize, (b) soybean and (c) sunflower during the mid-growing season in 2017 (red) and 2016 (green) derived from Landsat-8.
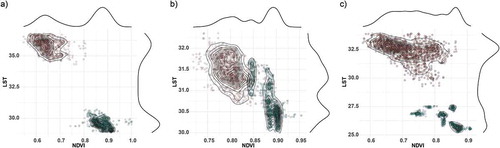
Figure 5. Time-series of NDVI derived from optical sensors for (a) Maize, (b) Sunflower, (c) Soy, (d) Wheat with blue depicting non-drought conditions (2016) and black drought conditions (2017).
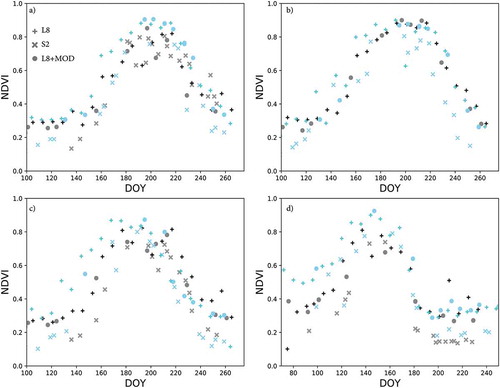
Figure 6. Time-series of backscattering coefficient for (a) Maize, (b) Sunflower, (c) Soy, (d) Wheat with blue depicting non-drought conditions (2016) and black drought conditions (2017).
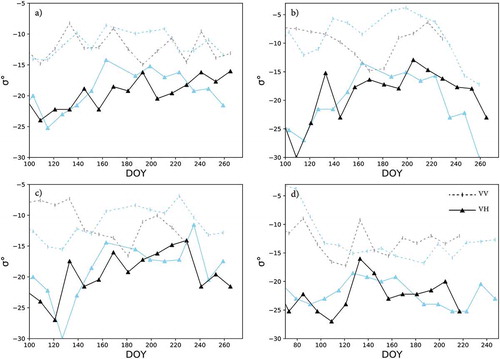
Figure 7. Length of the drought estimated in 2017 from (a) Landsat NDMI (b) Sentinel 2 NDMI, (c) Sentinel 1, (d) L8+ MOD NDVI.
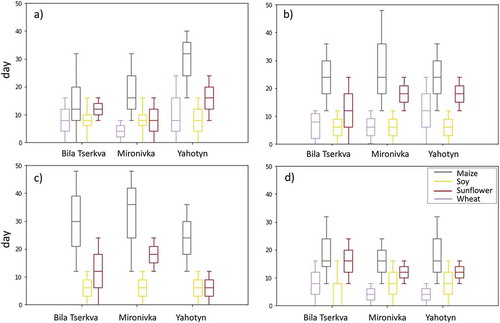
Figure 8. Spatially explicit drought mapping series based on Landsat time-series in June, July, and August during two sub-optimal growing seasons (a)-(c) in 2015 and (d)-(f) in 2017.
Figure 9. Drought-impacted crops in 2017 derived from (a)-(c) Sentinel 1 based Relative Surface Moisture and (d)-(f) Sentinel 2 based NDMI during the peak of the growing season (July).
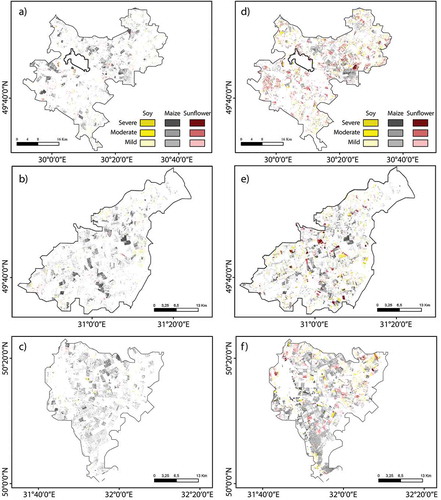
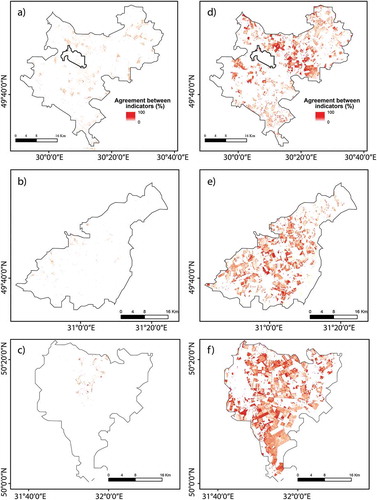
Figure 10. Percentage agreement between different indicators (a)-(c) in July 2015 (LST, S1, L8 NDMI, L8 NDVI, MOD+L8 NDVI) and (d)-(f) 2017 (LST, S1, L8 NDMI, S2 NDMI, MOD+L8 NDVI).
Data availability statement
The raw imagery is available from the Google Earth Engine data catalog (https://developers.google.com/earth-engine/datasets) (Landsat 8 Surface Reflectance, MOD09Q1.006 Terra Surface Reflectance, Sentinel-2 MSI, Sentinel-1 SAR GRD). Sharing of supporting in-situ datasets is subject to third party permission. They may be available on request providing permission is granted by the corresponding organizations.