
Figures & data
Figure 1. Location and distribution of 65 countries along the B&R region (The base image in Figure 1 comes from World Topographic Map, Esri. The blue part represents the ocean, and the rest represents the land)
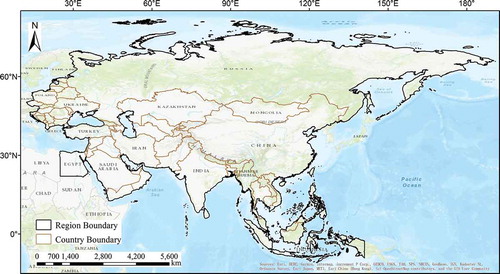
Table 1. Overview of the four land cover products
Figure 2. Flow chart of data fusion and correction of the four cropland products (CCI-LC, GFSAD30, MCD12Q1, and FROM-GLC)
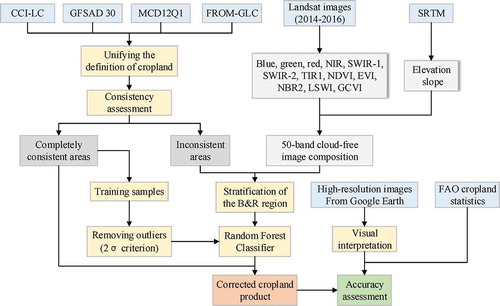
Table 2. Comparison of cropland definition according to the classification system of four land-cover products
Figure 3. Consistency degree of the four cropland products CCI-LC, GFSAD30, MCD12Q1, and FROM-GLC in the B&R region. The values of 1–4, respectively, represent one to four cropland products classified as cropland, and the value of 0 represents four cropland products classified as non-cropland
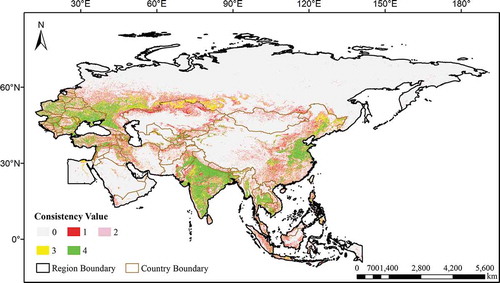
Figure 4. Map of corrected cropland products in the B&R region
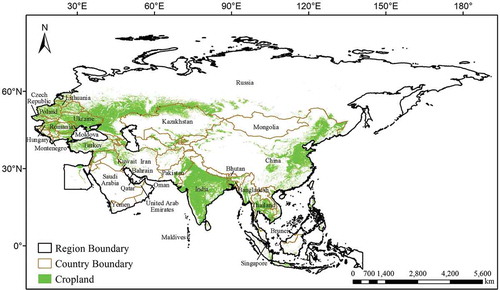
Figure 5. Degree of consistency of CCI-LC, GFSAD30, MCD12Q1, FROM-GLC and corrected cropland product in the B&R region. The values of 1–5 represent one to five cropland products classified as cropland
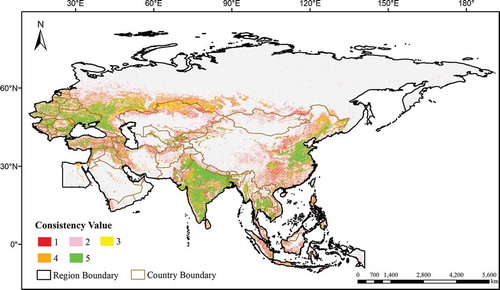
Figure 6. Dispersion degree and correlation analysis of the cropland proportion of cropland products and statistics. The dotted line is the 1:1 line of x:y, and the solid line is the linear regression line of the cropland products and statistics in 65 countries of the B&R region (RMSE: root mean square error, R2: coefficient of determination)
Figure 7. Spatial distribution of four cropland products and our corrected product. Based on the visual interpretation results of testing samples, CCI-LC and GFSAD 30 significantly overestimated the area of cropland in the plain of Eastern Europe (A) and Yunnan-Guizhou Plateaus (D), while MCD12Q1 and FROM-GLC clearly underestimated in the plain of Western Siberia (B) and Southeastern Asia (C)
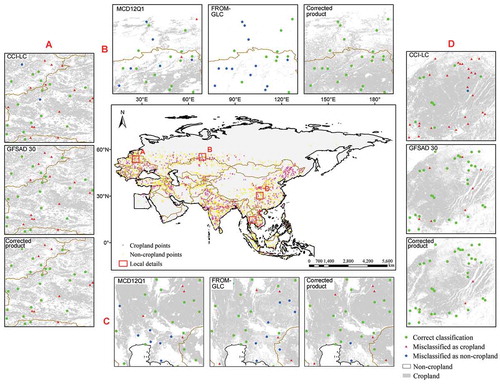
Table 3. Accuracy error matrices of four cropland products and our corrected product in inconsistent areas according to visually interpreted testing samples
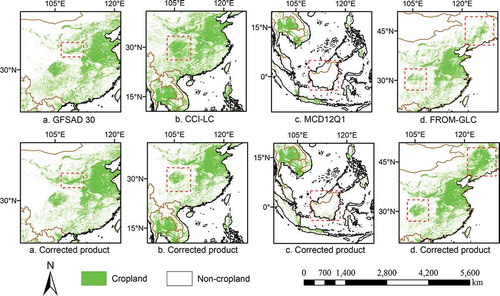
Figure 8. Enlarged window comparisons among four cropland products and corrected products, where (a) GFSAD 30 underestimated cropland on the Loess Plateau, particularly in Gansu and Henan provinces, China; (b) CCI-LC overestimated cropland in Southwest China, such as the Tibetan Plateau and Yunnan-Guizhou Plateau; (c) MCD12Q1 underestimated cropland in Southeast Asia; and (d) FROM-GLC had the lowest overall accuracy among all products. Artificial boundaries, caused by discontinuities where original image edges meet, can be observed in many areas such as China
Supplemental Material
Download Zip (2.7 MB)Data availability statement
Google Earth Engine (https://code.earthengine.google.com/) is a free and open platform. All data, models, or code generated or used during this study are available from the corresponding author upon request.