Figures & data
Figure 1. The methodology framework
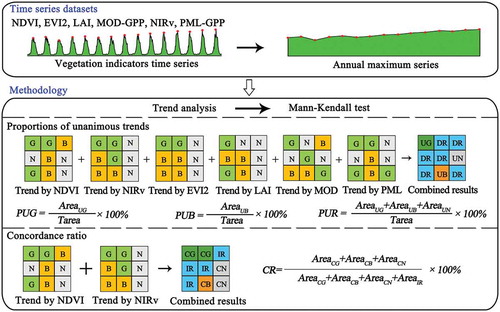
Figure 2. Maps of trends in six vegetation indicators (a-f), and the corresponding greening, browning, and net greening (g-i)
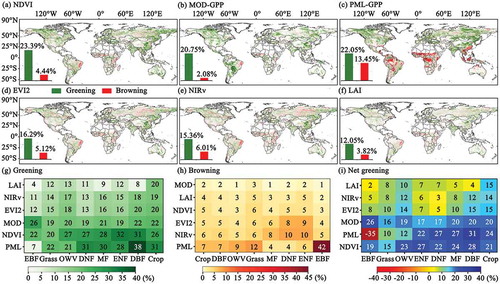
Figure 3. (a) Maps of proportions of unanimous greening, (b) and browning at country level, (c) probability distribution of change magnitudes; (d) and their associations with proportion of unanimous results; (e) net changes at country level; (f) major discrepancy
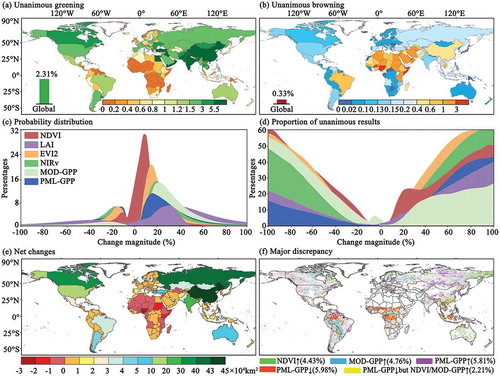
Figure 4. (a) Concordance ratios between different indicators at the global scale; (b) and under changes in climate; (c) boxplots of greening and browning under changes in climate (warming or cooling conditions, wetting or drying)
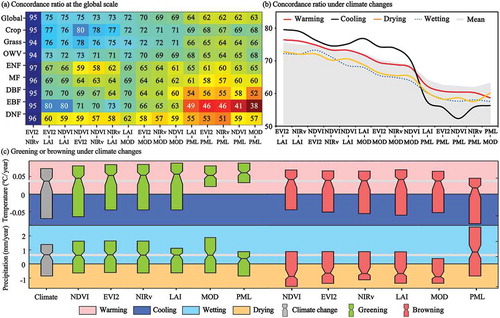
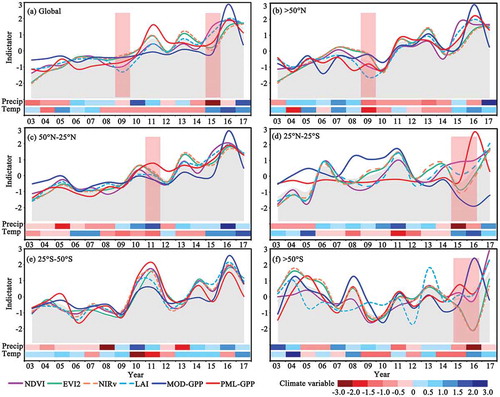
Figure 5. Inter-annual variations of six vegetation indicators and climatic variables globally (a) and across different latitudes (c-f)