
Figures & data
Figure 1. Aster GDEM (left side) and land cover types distribution in Greece in 2001, 2011 and 2018
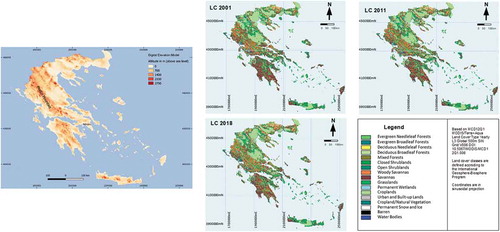
Figure 2. Spatial distribution of dominant land cover changes in Greece from 2001 to 2011 and from 2011 to 2018, based on MODIS land cover product and the International Geosphere-Biosphere Program classification scheme. Coordinates are in MODIS sinusoidal projection
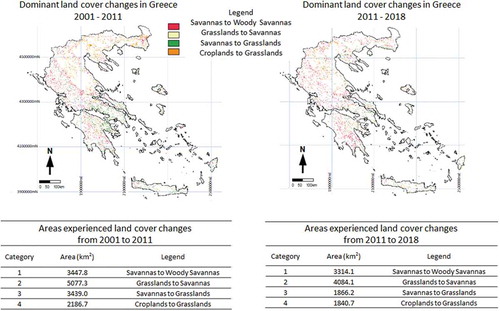
Figure 3. Gains and losses of various land cover types in Greece from 2001 to 2011 and from 2011 to 2018
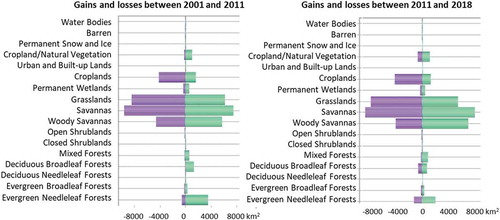
Table 1. Areas of various land cover types in Greece, in 2001, 2011, and 2018, based on MODIS land cover product
Figure 4. Historical climate data from 2000 to 2018 at 2.5 minutes grids (Harris et al. Citation2014): a) Mean Annual Precipitation (mm) and b) Mean Annual Minimum Temperature (oC)
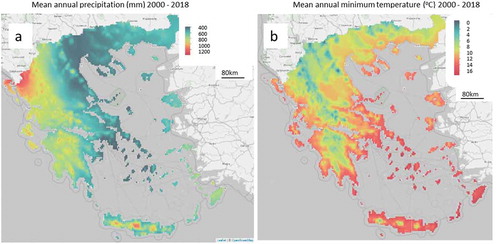
Table 2. Multilayer Perceptron LCM parameters
Table 3. LCM skill breakdown by transition and persistence
Figure 5. LCM sensitivity analysis, a) forcing a single variable constant, b) forcing all variables except one to be constant, c) using backward stepwise constant forcing
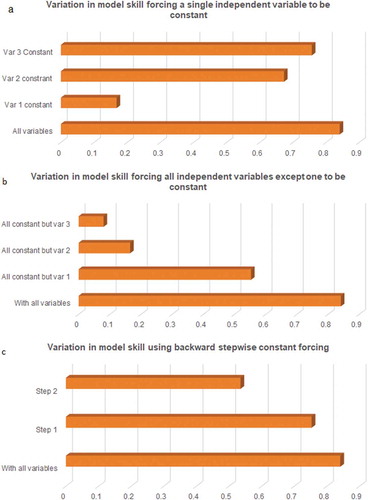
Table 4. Classification accuracy of predicted versus observed 2018 land cover
Figure 6. Future climate data (2021–2040) from CMIP6 at 2.5 minutes grids (Harris et al. Citation2014; L. Feng et al. Citation2020) provided as ensembles of 4 GCMs, i.e. BCC-CSM2-MR, CNRM-ESM2-1, PSL-CM6A-LR and MIROC-ES2L: a) Projected mean annual precipitation and b) mean annual minimum temperature based on the SSP126
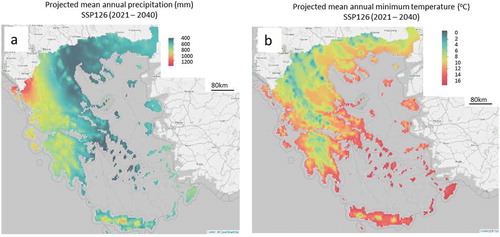
Figure 7. Future climate data (2021–2040) from CMIP6 at 2.5 minutes grids (Harris et al. Citation2014; L. Feng et al. Citation2020) provided as ensembles of 4 GCMs, i.e. BCC-CSM2-MR, CNRM-ESM2-1, PSL-CM6A-LR and MIROC-ES2L: a) Projected mean annual precipitation and b) mean annual minimum temperature based on the SSP585
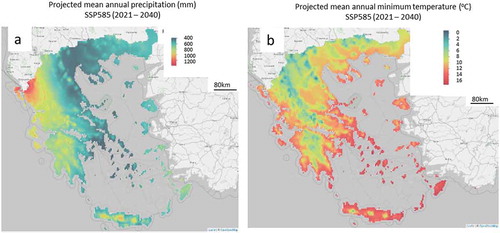
Figure 8. Comparison of observed land cover for 2001, 2011 and 2018, and predicted land cover for 2018 and 2030 in Greece under SSP126 and SSP585
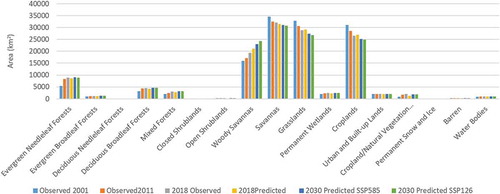
Figure 9. Spatial distribution of land cover transitions for the two examined scenarios, i.e. SSP126 and SSP585, for 2030 in Greece with reference the observed 2018 land cover
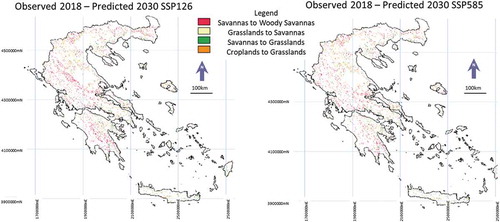
Table 5. Basic statistics of the examined climate scenarios over the study area
Table 6. Predicted versus observed land cover areas in various land cover types for 2018 and predicted land cover for 2030 under SSP126 and SSP585