
Figures & data
Figure 1. Location of the study area and distribution of the main species along elevation gradients (a) Distribution of the main forest species across the Spanish Pyrenees; (b) Location of the study area within Southern Europe; (c) Detail of the distribution of the main species along elevation gradients in a valley in the Central Pyrenees; (d) Violin plots showing the overall distribution of the main species across the elevation gradient in the Pyrenees, as observed using PNOA LiDAR data and the Spanish Forest Map
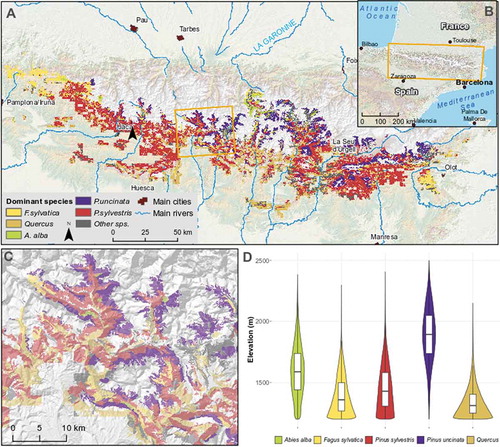
Table 1. Summary of the results for the fitted models of maximum canopy height as a function of elevation
Figure 2. High-resolution (20 m) canopy height grid of the Spanish Pyrenees as derived from the Spanish Airborn LiDAR plan (PNOA). Canopy height was higher at both ends of the Pyrenees, where the sea influence softens the climate and allows the presence of tree species such as fir or beech
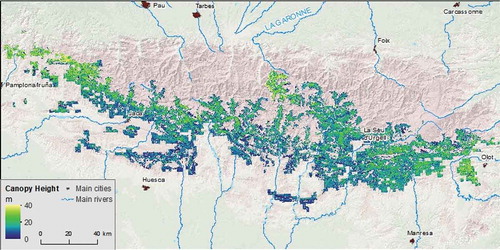
Figure 3. Relationship between terrain elevation and maximum canopy height across the Spanish Pyrenees, as determined from airborne LiDAR data. Orange lines represent the predictions according to a segmented log-linear regression model, and dashed line represents the breakpoint identified by the same model. Values indicate the approximate rate of change in maximum canopy height for a 100 m change in elevation below and above the breakpoint. The segmented log-linear model is the average prediction of 1,000 models fitted to random subsets of the original dataset. R2 is calculated as the coefficient of determination of the relationship between the observed data and the predicted data using the validation dataset
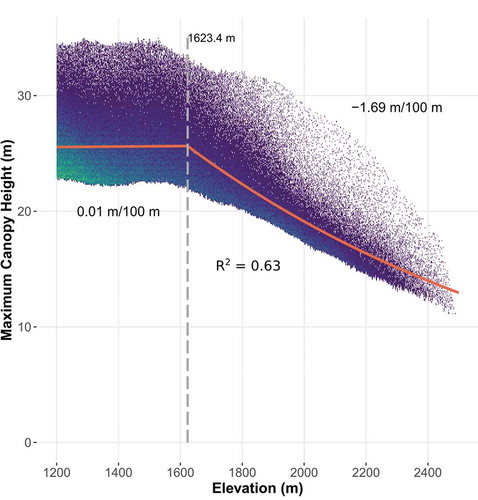
Table 2. Mean and sd of r-squared and RMSE of the 1000 tested models for each realization. Model name refers to the variable included as predictor of maximum canopy height, whereas Full Model refers to a multivariate model including all the possible predictors
Figure 4. Variation of maximum canopy height with elevation and climatic variables. Maximum canopy height increases with increasing temperature (A) and decreasing precipitation (B) but this relationship is explained by the covariation between elevation and climate variables (see ). Elevation breakpoint is indicated by the dashed gray line
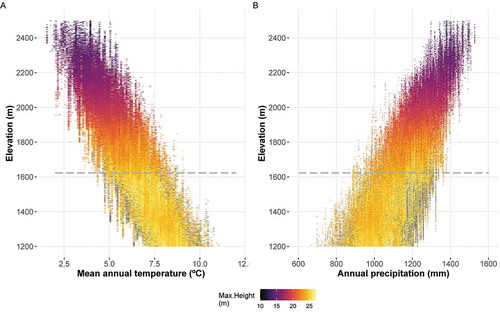
Figure 5. Relationship between terrain elevation and maximum canopy height in the Spanish Pyrenees, split for north-facing and south-facing slopes. Orange lines represent the predictions according to a segmented log-linear regression model, and dashed line represents the breakpoint identified by the same model. Values indicate the approximate rate of change in maximum canopy height for a 100 m change in elevation below and above the breakpoint. The segmented log-linear model is the average prediction of 1,000 models fitted to random subsets of the original dataset. R2 for each model is calculated as the coefficient of determination of the relationship between the observed data and the predicted data using the validation dataset
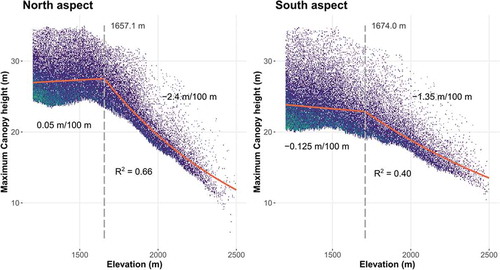
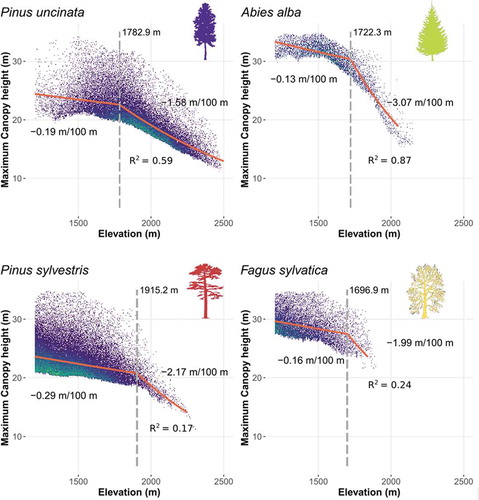
Figure 6. Relationship between terrain elevation and maximum canopy height in the Spanish Pyrenees, split across the main dominant species. Orange lines represent the predictions according to a segmented log-linear regression model, and dashed line represents the breakpoint identified by the same model. Values indicate the approximate rate of change in maximum canopy height for a 100 m change in elevation below and above the breakpoint. The segmented log-linear model is the average prediction of 1,000 models fitted to random subsets of the original dataset. R2 for each model is calculated as the coefficient of determination of the relationship between the observed data and the predicted data using the validation dataset
Data and codes availability statement
The data that supports the findings of this study is available in FigShare at https://doi.org/10.6084/m9.figshare.13213823