Figures & data
Figure 1. (a) Location of the Zoige wetland in China, (b) the boundary of the study area, (c) the true color composite image of the Landsat 8 OLI data of the whole study area
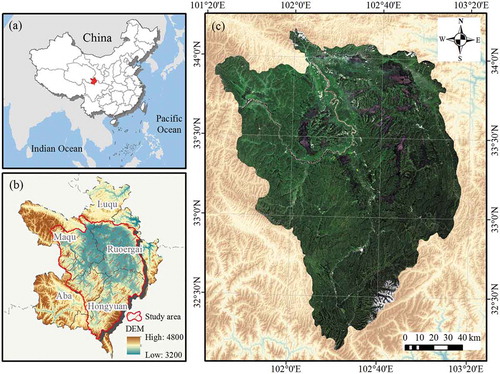
Table 1. List of input features used for wetland cover classification. NDVI = normalized difference vegetation index, NDWI = normalized difference water index, MEAN = mean, HOMO = homogeneity, ASM = angular second moment, DIS = dissimilarity, ENTR = entropy, VAR = variance
Figure 2. Locations of reference samples in the study area and typical examples of wetland covers in the Landsat 8 OLI images. AM = alpine meadow, MM = marsh meadow, M = marsh, RL = river and lake, FP = floodplain, S = sediments, RA = residential area, BR = bedrock
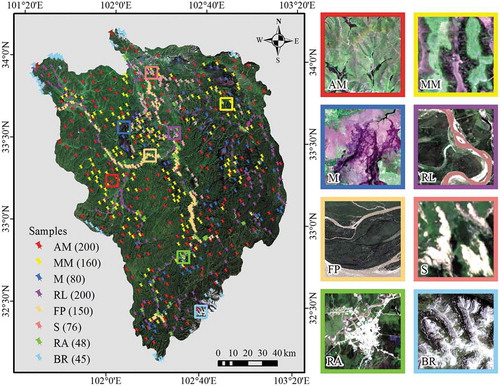
Table 2. Descriptions of wetland cover categories used in this study
Figure 3. The flowchart of wetland cover classification. ANN = artificial neural network, MBANN = MultiBoost artificial neural network, RANN = rotation artificial neural network, VGG = visual geometry group, RF = random forests
Figure 4. Illustration of the MBANN method. ANN = artificial neural network, MBANN = MultiBoost artificial neural network, AB = AdaBoost
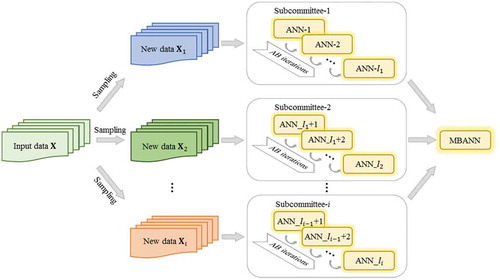
Figure 5. Illustration of the RANN method. ANN = artificial neural network, RANN = rotation artificial neural network, PCA = principal component analysis
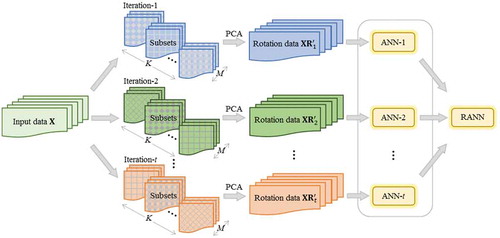
Table 3. Classification accuracy evaluation and comparison of various classification methods. ANN = artificial neural network, MBANN = MultiBoost artificial neural network, RANN = rotation artificial neural network, VGG11 = visual geometry group, RF = random forests. AM = alpine meadow, MM = marsh meadow, M = marsh, RL = river and lake, FP = floodplain, S = sediments, RA = residential area, BR = bedrock
Table 4. Z-score test with associated probability value (P) for model pairs. ANN = artificial neural network, MBANN = MultiBoost artificial neural network, RANN = rotation artificial neural network, VGG11 = visual geometry group, RF = random forests
Figure 6. Wetland cover maps obtained by the five classifiers: (a) artificial neural network, (b) MultiBoost artificial neural network, (c) rotation artificial neural network, (d) visual geometry group, and (e) random forests
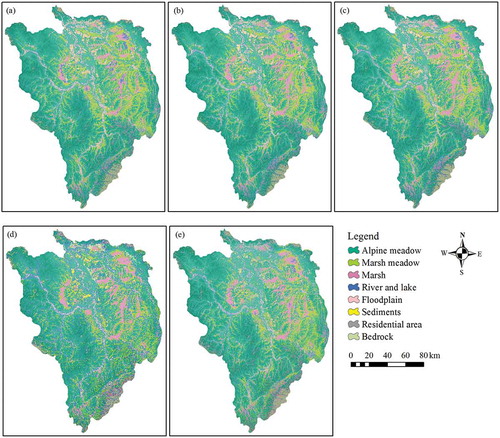
Figure 7. Area percentages of wetland cover classes predicted by different classification methods. ANN = artificial neural network, MBANN = MultiBoost artificial neural network, RANN = rotation artificial neural network, VGG11 = visual geometry group, RF = random forests
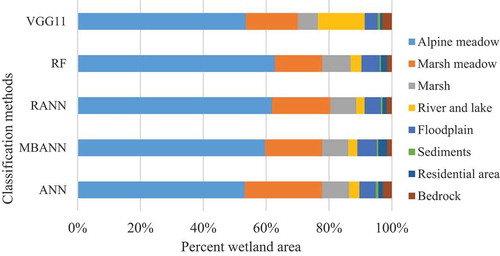
Figure 8. Robustness evaluation concerning the impact of the data size on the classification accuracy of classifiers. RANN = rotation artificial neural network, MBANN = MultiBoost artificial neural network, ANN = artificial neural network, RF = random forests, VGG11 = visual geometry group
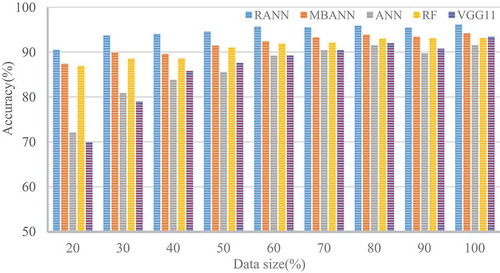
Figure 9. Robustness evaluation concerning the impact of the data noise on the classification accuracy of classifiers. RANN = rotation artificial neural network, MBANN = MultiBoost artificial neural network, ANN = artificial neural network, RF = random forests, VGG11 = visual geometry group
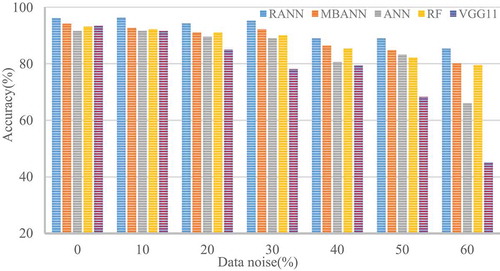
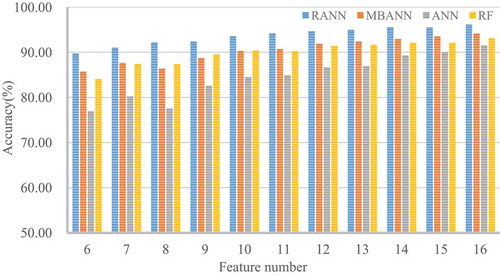
Figure 10. Robustness evaluation concerning the impact of the feature variation on the classification accuracy of classifiers. RANN = rotation artificial neural network, MBANN = MultiBoost artificial neural network, ANN = artificial neural network, RF = random forests