
Figures & data
Table 1. List of studies discussing SUHI across different climatic zone considering different potential drivers
Figure 1. Spatial distribution of selected 150 Indian cities with respect to different Köppen–Geiger classification zone. The LULC map obtained from the climate change initiative (CCI) of the European Space Agency (ESA) is reported in the background
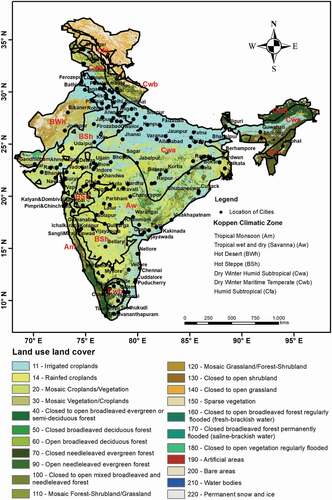
Figure 2. Schematic diagram of selection of urban and rural areas, using (a) Ahmedabad as larger patch city, (b) Chennai as coastal patch city, and (c) comparison of large Indore and small Mhow city together with different width of rural buffer
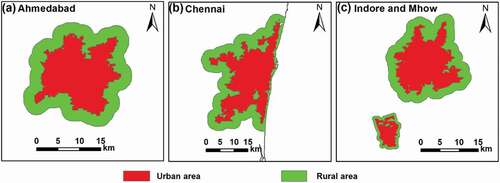
Figure 3. Mean surface urban heat island intensity (SUHII) over 150 major Indian cities in (a) summer daytime, (b) summer nighttime, (c) winter daytime, and (d) winter nighttime across different Köppen climatic zone during 2003–2018
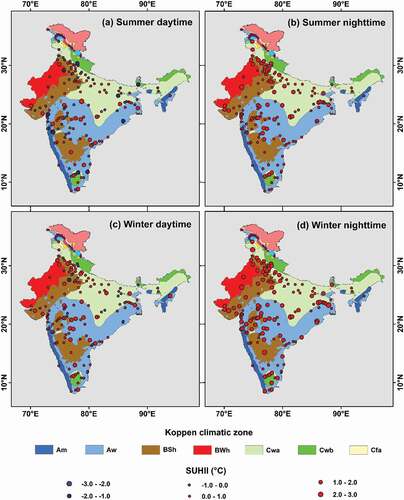
Table 2. Mean SUHII (for all the cities) in °C, over different climatic zones during 2003–2018
Figure 4. Box plot showing the variation of SUHII in different Köppen climatic zone during 2003–2018 (SD: summer daytime; SN: summer nighttime; WD: winter daytime; and WN: winter nighttime)
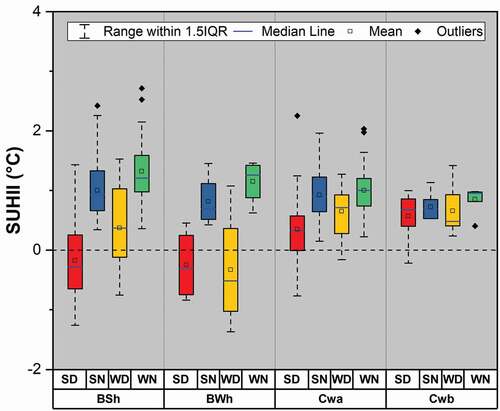
Table 3. Temporal trend of SUHII (for all the cities) in the different climatic zone during 2003–2018
Figure 5. Annual variation of SUHII (°C) over selected 150 cities during 2003–2018 in (a) summer daytime, (b) summer nighttime, (c) winter daytime, and (d) winter nighttime (number of cities on X-axis is as per the serial number of cities in Table S1, provided in the supplementary material)
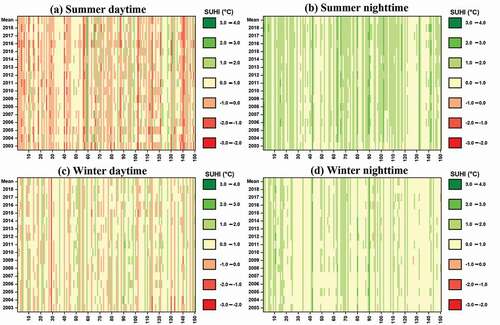
Figure 6. Temporal trend of SUHII over 150 Indian cities during (a) summer daytime, (b) summer nighttime, (c) winter daytime, and (d) winter nighttime across different Köppen climatic zone from 2003 to 2018
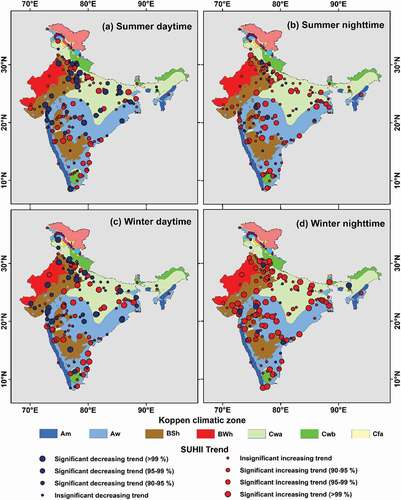
Table 4. Results of stepwise multiple linear regression for all the cities in 2003–2018. Pearson’s correlation coefficients between the SUHII and the selected driving variables are reported, as well as the overall R2 and p-value of stepwise multiple linear regression
Figure 7. Pearson’s correlation between SUHII and six drivers (BI, ΔEVI, ΔET, ΔWSA, ΔTI, and ΔNL) over (a) tropical wet and dry (Aw), (b) dry winter humid subtropical (Cwa), (c) dry winter maritime temperate (Cwb), (d) hot steppe (BSh), and (e) hot desert (BWk) climatic zone in summer daytime (SD), winter daytime (WD), summer nighttime (SN), and winter nighttime (WN)
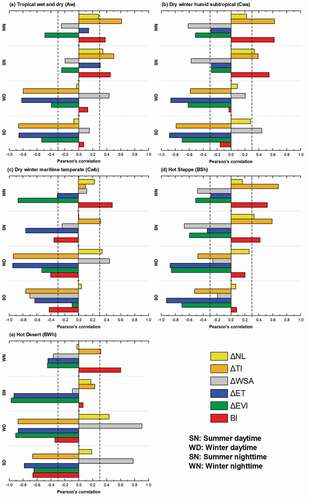
Figure 8. SUHII and thermal inertia (TI) relationship across the different climatic zone in (a) summer daytime, (b) winter daytime, (c) summer nighttime, and (d) winter nighttime
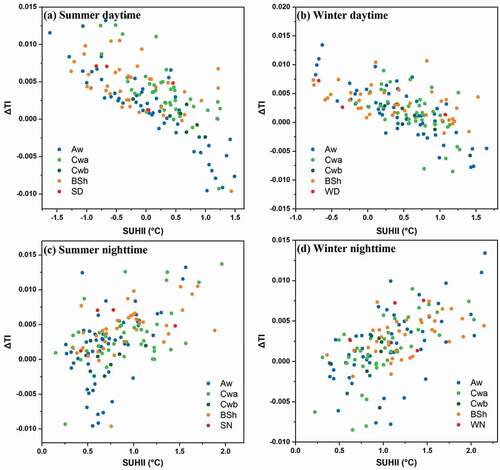
Figure 9. SUHI and soil moisture (SM) relationship for UHI/UCI across the different climatic zone in summer daytime (SD), winter daytime (WD), summer nighttime (SN), and winter nighttime (WN)
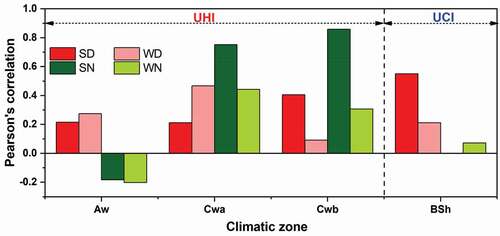
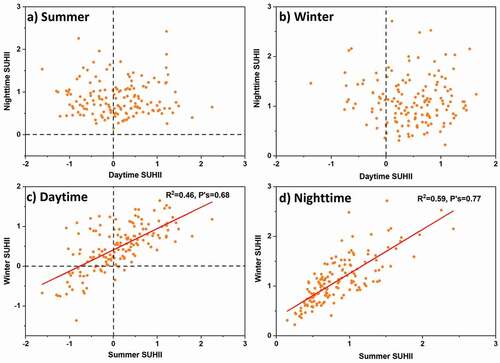
Figure 10. Relationships of SUHII (°C) between the daytime and nighttime during summer (a) and winter (b), and between summer and winter during the daytime (c) and nighttime (d) across India’s 150 major cities averaged over the period 2003–2018
Supplemental Material
Download MS Word (71.4 KB)Data and codes availability statement
The data and codes that support the findings of this study are available on request from the corresponding author.