
Figures & data
Figure 1. Location of the TEB on the world map. The superimposed black frames are the footprint of Landsat 8 imagery
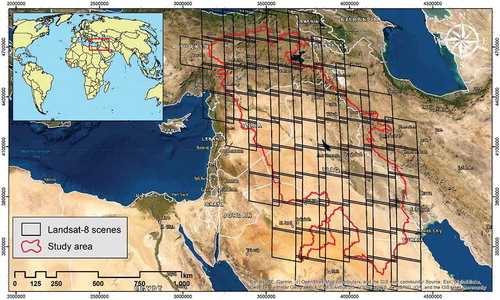
Figure 2. Flowchart of the general process of LULC classification within the GEE environment
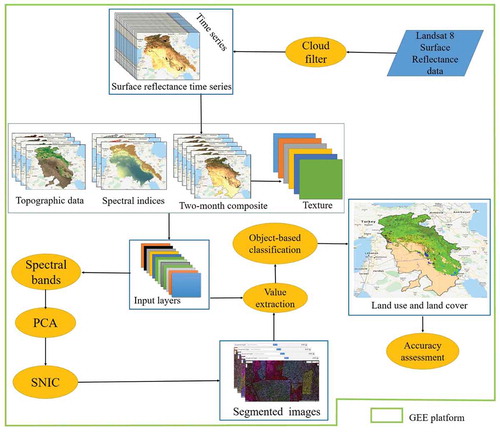
Figure 3. Distribution of training and test samples over the study area. Descriptions of climatic regions and their proportions in the study area are as follows: BSh: hot desert (17.55%), BWh: hot semi-arid (40.08%), Csa: monsoon-influenced humid subtropical climate (29.02%), Dfb: dry summer continental (0.55%), and Dsb: humid subtropical (12.77%)
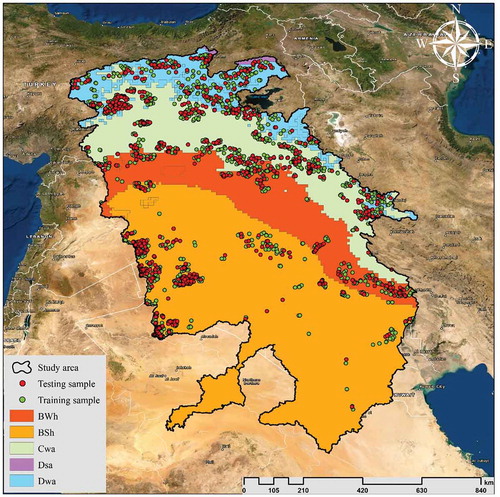
Table 1. Number of training and test samples for LULC classification
Table 2. Input variables for RF algorithm to generate LULC map
Figure 4. Image segmentation using the SNIC algorithm
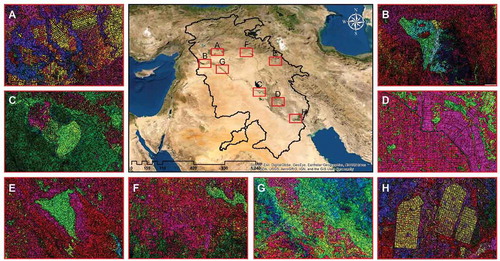
Figure 5. Schematic representation of parallel processing to prevent computational time-out error
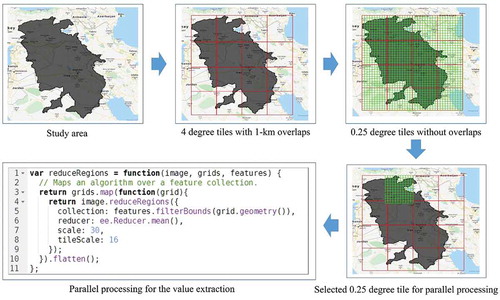
Figure 6. The importance of input variables to create a LULC map of the TEB using the RF algorithm. The horizontal axis represents the relative importance of input variables, and T1 to T6 in the vertical axis represent the months of the year as two-month intervals from January to December
Figure 7. The 30-m Landsat-derived LULC map for the nominal year 2019 for the TEB (upper panel). Visual assessment of a few sample locations labeled A-D (middle panel) against a natural color composite of high resolution Google Earth imagery (lower panel)
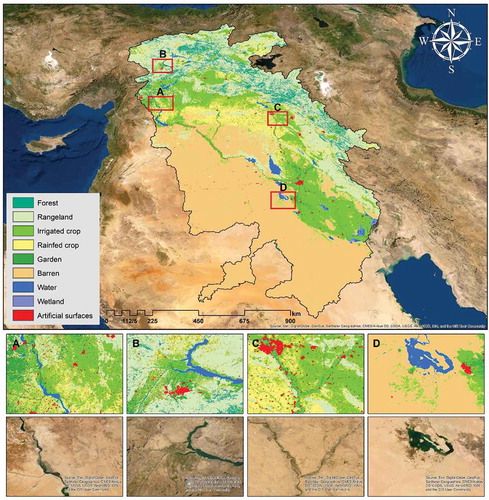
Table 3. Area and percentage of each land use and land cover type in the TEB in 2019
Table 4. Confusion matrix for the generated LULC map of the TEB. Columns represent reference data, and rows represent the mapped classes