
Figures & data
Figure 1. Map of the study area showing (A) the United States and Canada provinces in the Prairie Pothole Region, (B) the natural subregions of Alberta overlayed with the northwestern extent of the Prairie Pothole Region and (C) a summer Sentinel-2 natural composite of the study area for 2020
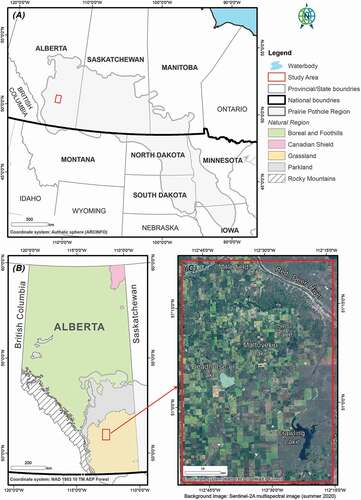
Figure 2. Sentinel-2 multispectral time-series images illustrating the dynamic nature of prairie pothole wetlands in spring/summer (May–August) and fall (September–November) months of 2017, 2018, 2019 and 2020
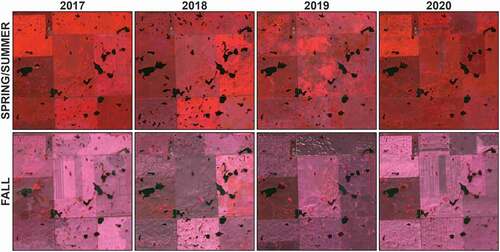
Table 1. Description of wetland and upland classes considered in the study
Figure 3. Training and testing data (from Canadian data inventories) used for image classification and accuracy assessment in the study
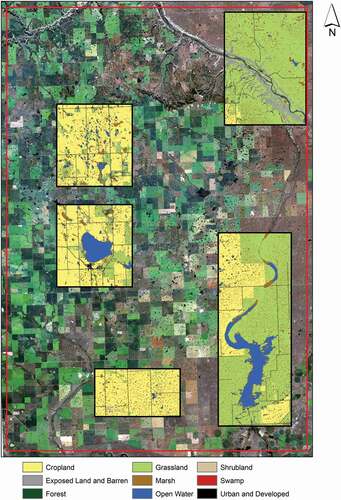
Table 2. Training and testing data used in the study for image classification and accuracy assessment
Table 3. Characteristics of Sentinel-1, Sentinel-2, and LiDAR elevation data explored in the study
Figure 4. Proposed workflow for wetland mapping using multi-temporal freely available Sentinel 1 SAR and Sentinel 2 optical data combined with LiDAR-derived topographic metric
Table 4. Fused datasets used for experiments utilizing multi-seasonal (spring/summer & fall) Sentinel-1 radar and Sentinel-2 multispectral data and LiDAR-derived topographic variables (where B8 = near-infrared band, B11 = shortwave infrared band, VH = vertical and horizontal dual-polarization channel, TWI = topographic wetness index)
Figure 5. Examples of the reclassified Alberta Biodiversity monitoring institute 3 × 7 photo plot data reference layer used for wetland comparison
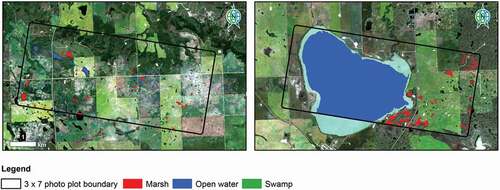
Table 5. McNemar’s test results of classifications performed in the study
Table 6. Per-class accuracy results of multi-temporal Sentinel SAR and optical data fused with LiDAR topographic index evaluated in the study (best results in bold and italics)
Figure 6. Graph showing the classification accuracy results in the study. The best performing dataset (Dataset 5) generated using the RF classifier (* denotes RF, ** CART, and *** SVM classified datasets)
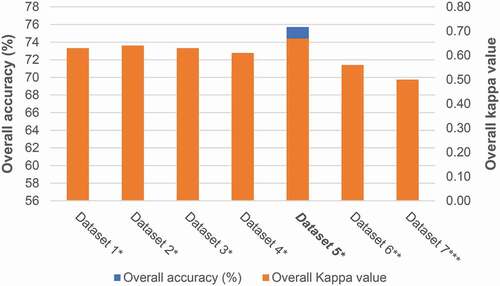
Figure 7. Optimal wetland classification generated using multi-temporal Sentinel-2 multispectral and Sentinel-1A radar imagery fused with LiDAR-derived Topographic Wetness Index
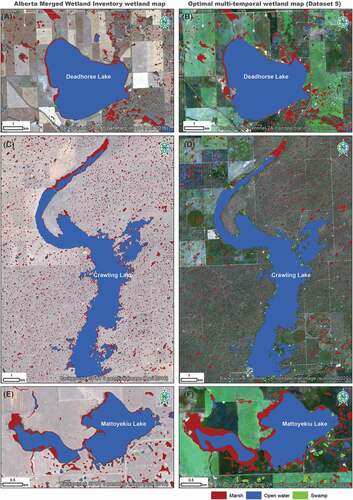
Table 7. Summary statistics of the Alberta merged wetland inventory dataset and optimal wetland map generated in this study
Table 8. Classification accuracy results of AMWI and Dataset 5 wetland maps
Figure 8. Comparison of AMWI and optimal multi-temporal wetland products of selected sites in the study area – Deadhorse Lake (A and B), Crawling Lake (C and D), and Mattoyekiu Lake (E and F)
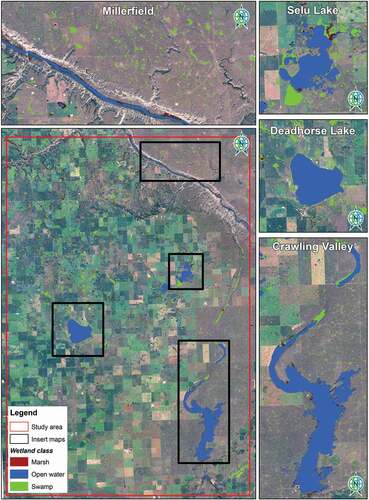
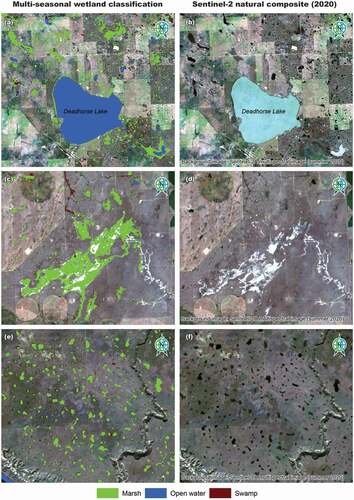
Figure 9. Examples of selected areas in showing a visual comparison of the optimal wetland inventory (a, c, and e) and medium resolution Sentinel-2 natural composite image (b, d, and f)
Supplemental Material
Download MS Word (3.4 MB)Data and Codes Availability Statement
The authors confirm that the data supporting the findings of this study are available within the article and its supplementary materials.